Qflex-AMQ - Anypoint MQ Monitoring Application

Anypoint MQ Monitoring

Stop Flying Blind with Anypoint MQ

Real-time queue monitoring, intelligent alerts, and usage tracking for MuleSoft teams - deployed in 5 minutes, runs on just 0.1 vCores.

Get Started Free Setup Guide & Demos ?

No credit card required. Free Community Edition available.

Sound Familiar?

MuleSoft gives you Anypoint MQ. But monitoring it? You're mostly on your own.

😰 Queue Depth Blindness

Messages pile up, consumers fall behind, and you don't know until something breaks. Built-in stats are delayed and lack alerting.

💸 Surprise MQ Bills

One runaway process can blow through your monthly budget before anyone notices. Anypoint MQ bills by API requests and billable units.

🔍 No Message Visibility

A message is stuck or stale - but which one? Browsing messages means API calls and guesswork. No native UI for it.

🔇 Silent Config Changes

Someone renamed a queue or changed an exchange binding. Nothing logged it. You find out when flows start failing.

What Qflex-AMQ Actually Does

Built by a MuleSoft architect who got tired of the gaps. Every feature exists because we needed it.

📊

Real-Time Queue Depth

Track queue depth, in-flight messages, sent and received counts. Get alerted when depth exceeds OR drops below your limits.

🔔

12 Built-in Monitor Types

Queue depth, in-flight depth, QoS dequeue rate, stale message detection, billing alerts, audit change detection - all DataWeave-powered.

📨

Message Browsing & Sending

Browse messages in any queue from the dashboard. View headers and payloads. Post test messages or purge queues - no Postman needed.

💰

Usage & Billing Tracking

Monitor billable unit counts and API request volumes in real time. Set billing alerts so you never get a surprise invoice again.

🕵️

Audit Trail & Change Detection

Detect when queues or exchanges are created, modified, or deleted. Get notified with who changed what and when.

Stale Message Detection

Find messages stuck in queues that haven't been consumed. Configurable staleness thresholds alert you before they become a production issue.

Up and Running in 5 Minutes

Pure Mule 4 application. No external infrastructure, no agents, no sidecars.

1

Deploy

Deploy to CloudHub or Runtime Fabric. Uses just 0.1 vCores - the smallest worker available.

2

Configure

Connect your Anypoint credentials. Qflex-AMQ auto-discovers all queues and exchanges.

3

Monitor

Real-time dashboards, customizable alerts, message browsing - all from one UI.

0.1 vCores
Min CloudHub Worker
Mule 4
Pure Mule App
CH / RTF
Deployment Options
12+
Monitor Types
DataWeave
Custom Rules Engine
Connected App
Secure Auth

Simple, Honest Pricing

Start free. Upgrade when your team needs more.

Community

Free / forever
  • ✔ Up to 5 queues monitored
  • ✔ Real-time queue depth alerts
  • ✔ Message browsing
  • ✔ Basic email notifications
  • ✔ 1 environment
  • ✔ Community support
Get Started Free
MOST POPULAR

Enterprise

Contact Us / custom
  • ✔ Unlimited queues & exchanges
  • ✔ All 12+ monitor types
  • ✔ Billing & usage tracking
  • ✔ Audit trail & change detection
  • ✔ Stale message detection
  • ✔ On-demand reports
  • ✔ Multi-environment support
  • ✔ Slack/PagerDuty integration
  • ✔ Priority support & onboarding
Contact Sales

Frequently Asked Questions

How is this different from Anypoint Monitoring?

Anypoint Monitoring tracks Mule app performance (CPU, memory, response times). Qflex-AMQ monitors your messaging infrastructure - queue depths, message flow, consumer rates, billing, and configuration changes. They're complementary.

Does it require admin access to my Anypoint org?

No. Qflex-AMQ uses a Connected App with read-only scopes for MQ stats. Write access (for message posting/purging) is optional.

Will it increase my Anypoint MQ bill?

Minimal overhead - typically less than 1% of a normal workload's API requests. The billing monitor will likely save you money by catching runaway processes early.

Can I deploy it on-premises?

Yes. Deploy to CloudHub, Runtime Fabric, or any on-prem Mule runtime. It just needs HTTPS access to Anypoint Platform APIs.

Can I write custom monitor rules?

Yes - monitors are DataWeave expressions. If you know DWL, you can write custom alert logic beyond the 12 built-in types.

Qflex-AMQ - the ultimate solution for monitoring Mulesoft's Anypoint MQ messaging infrastructure.

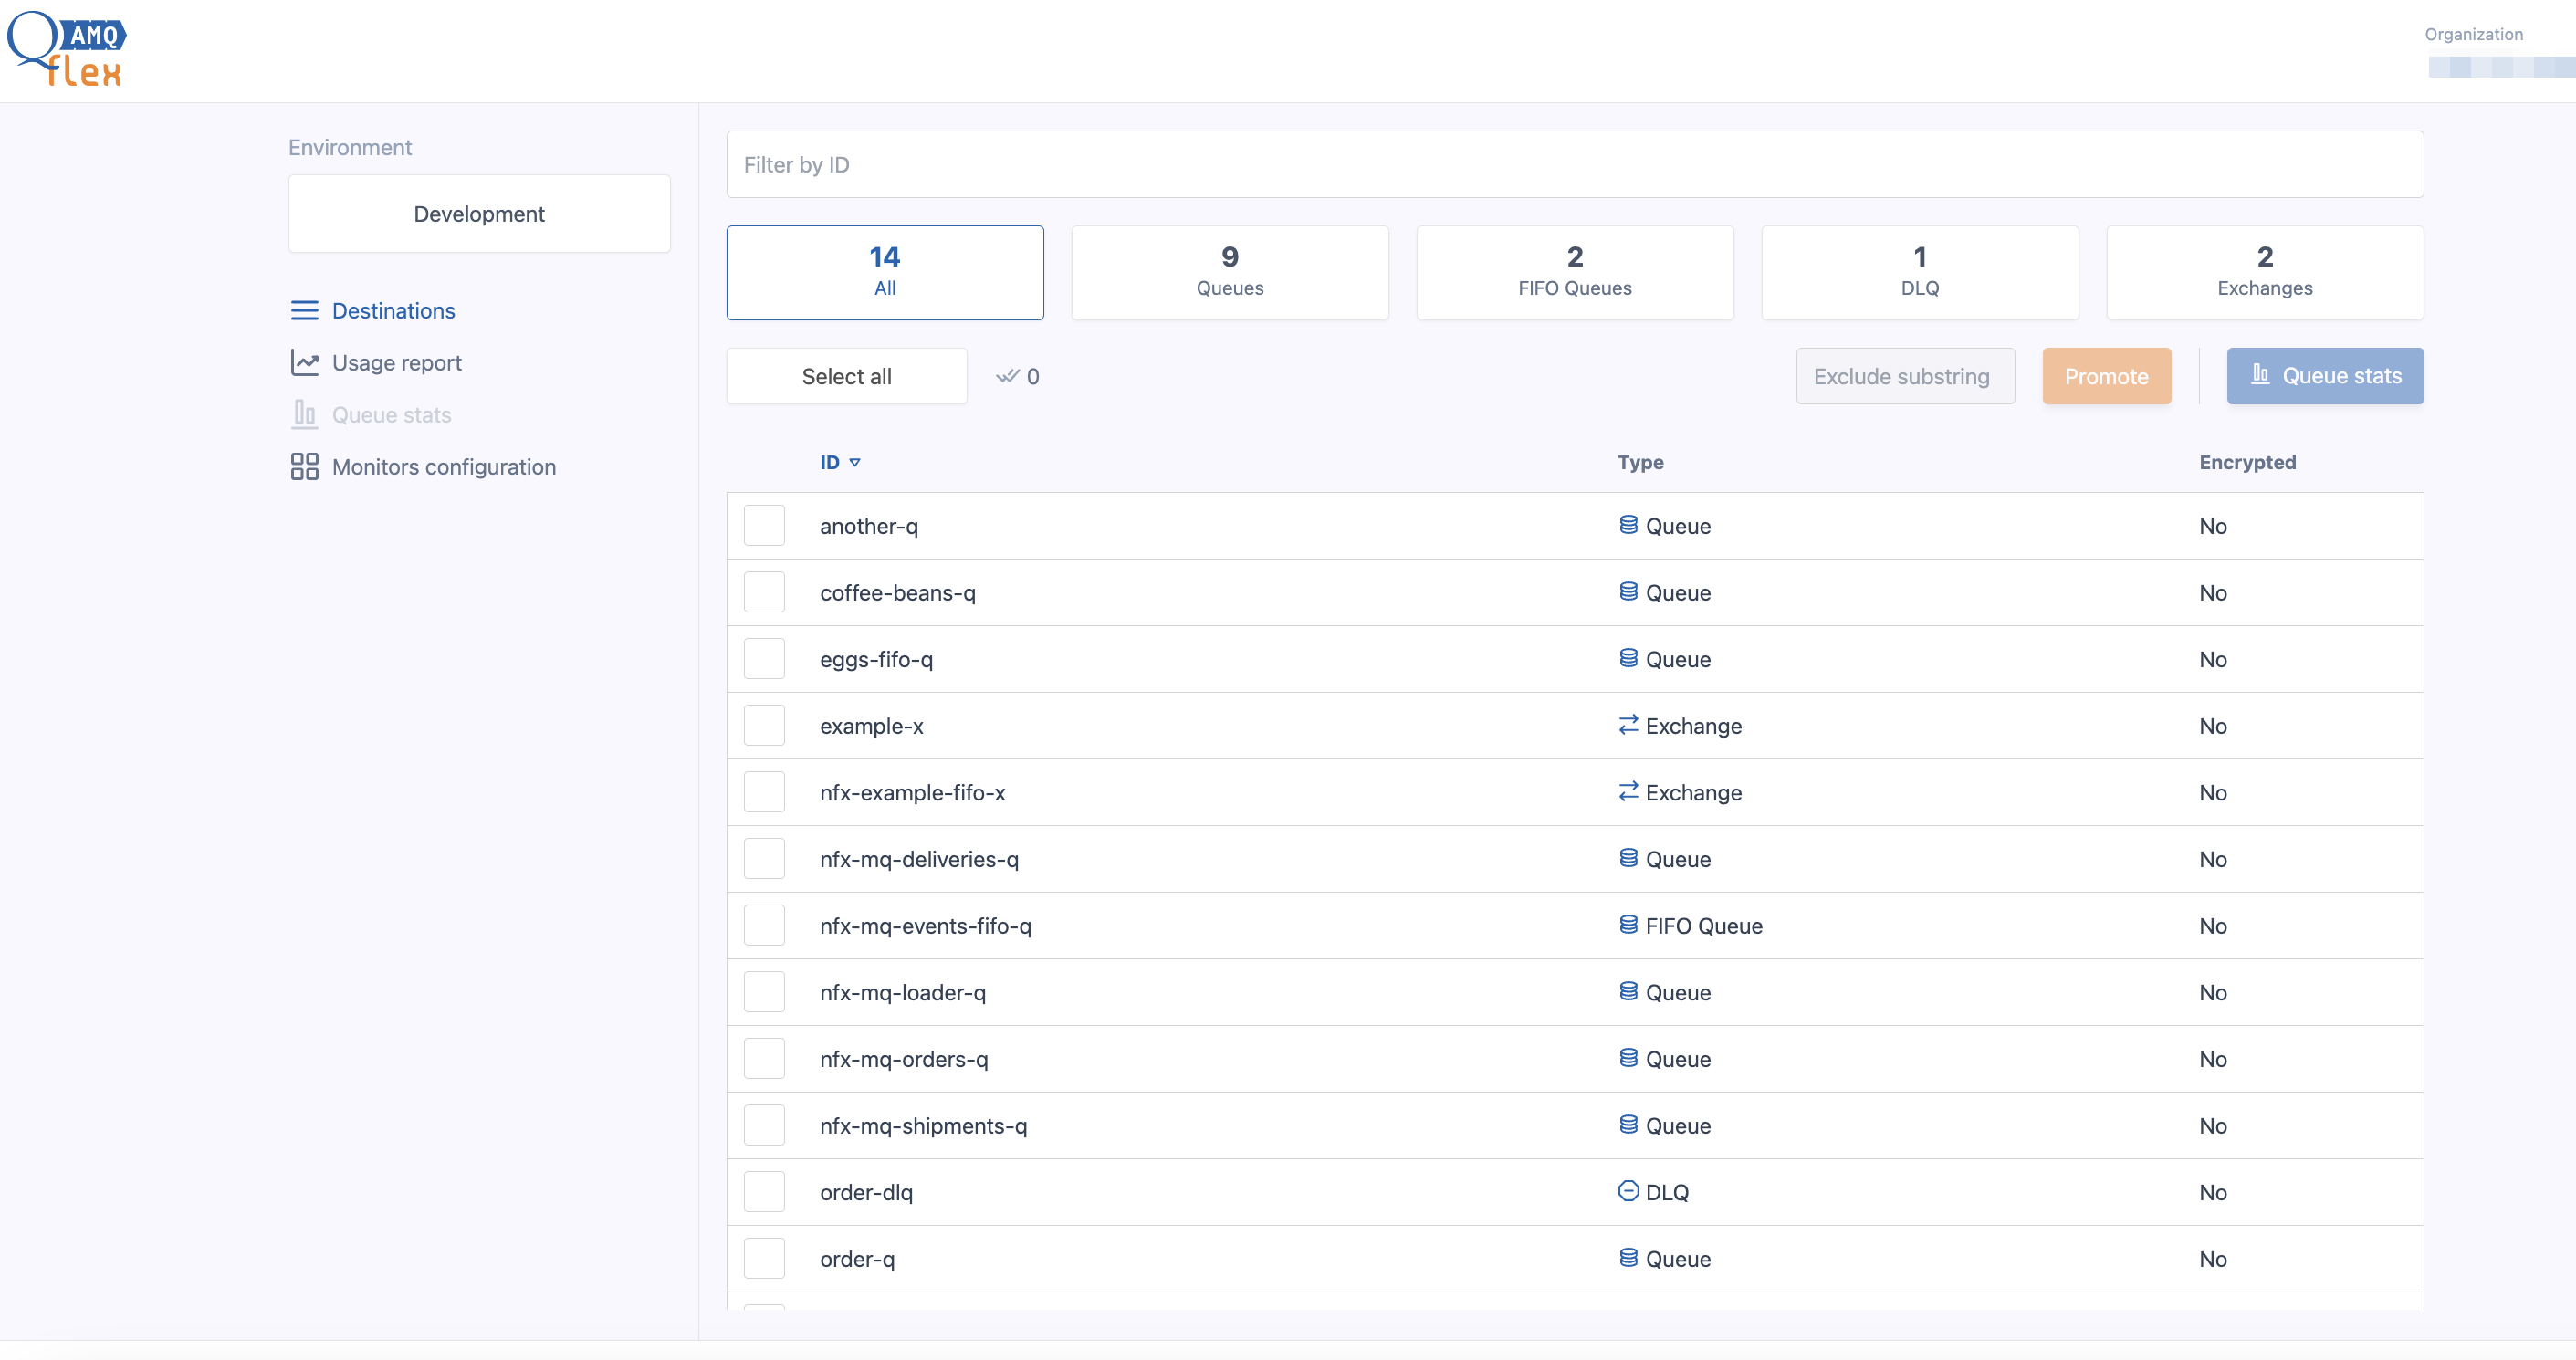
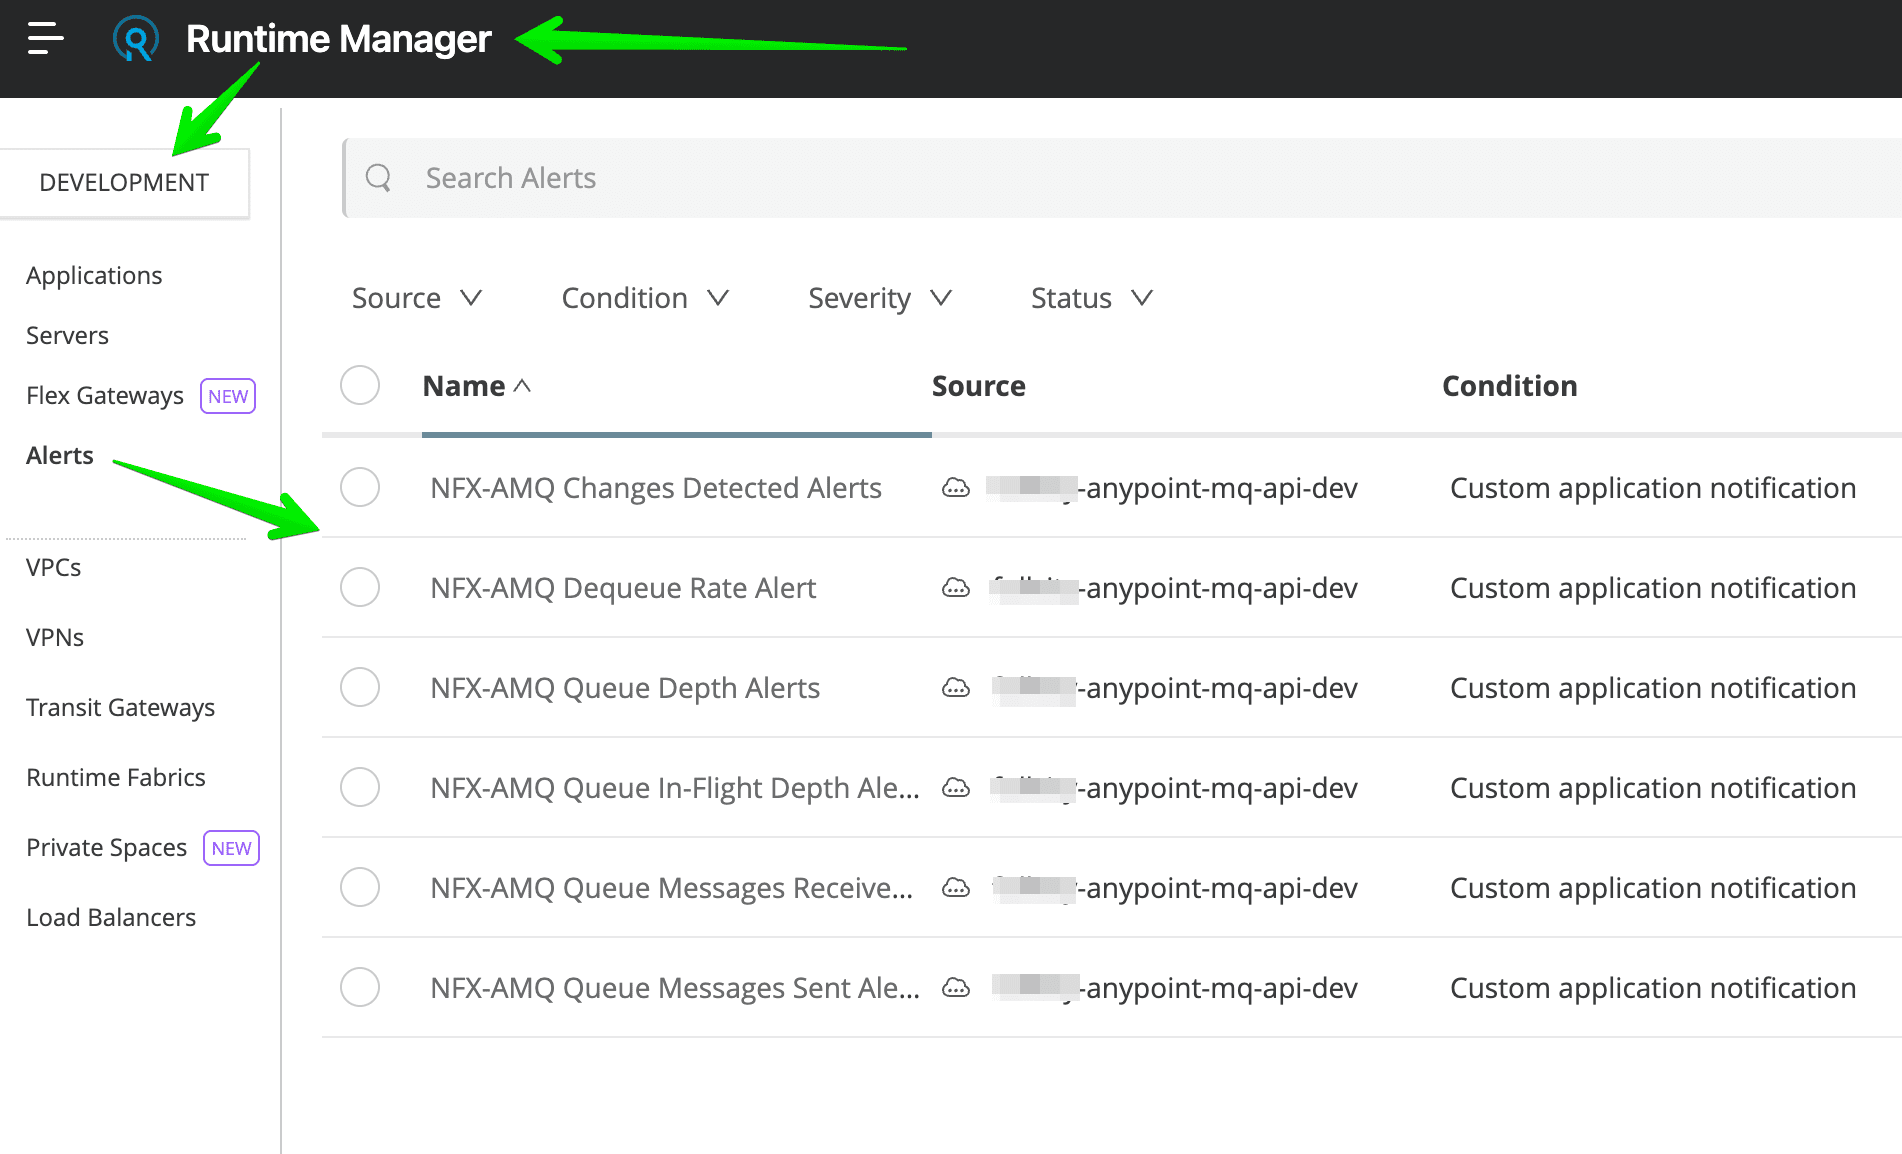
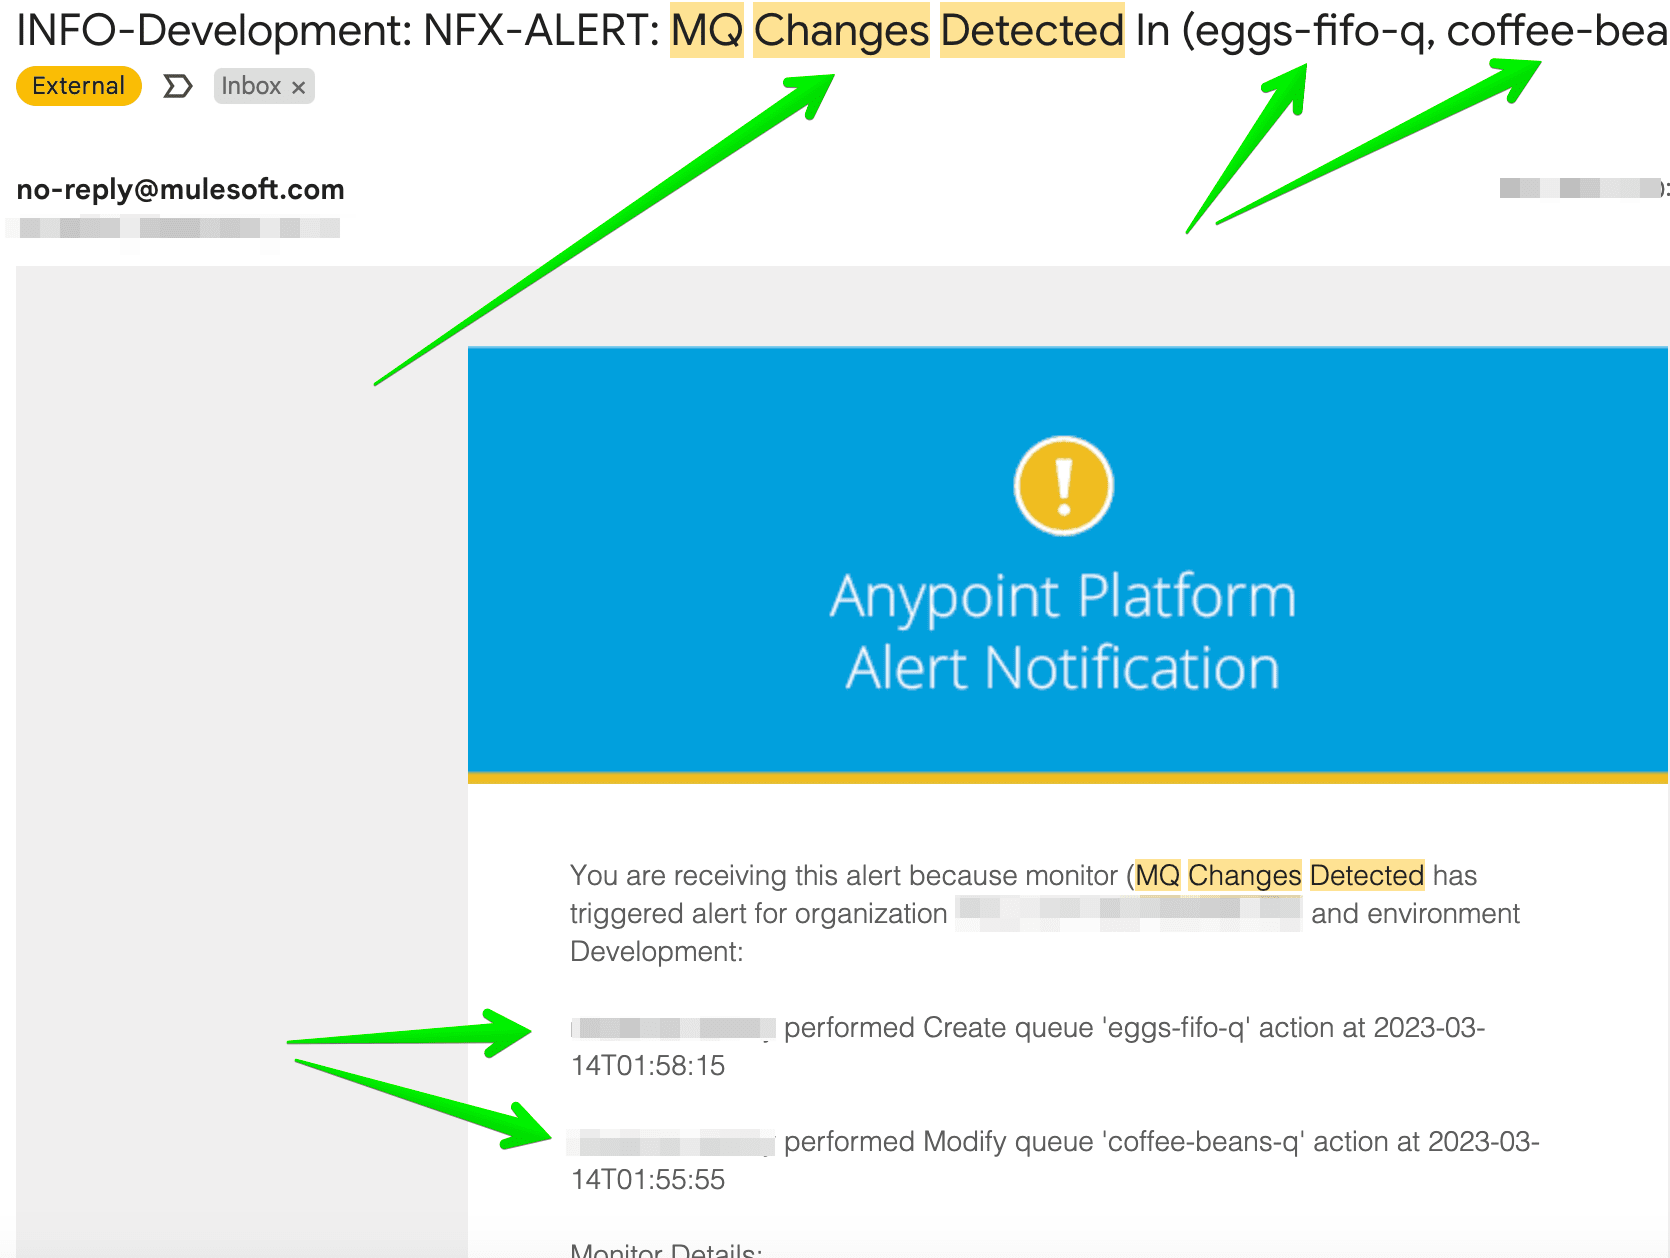
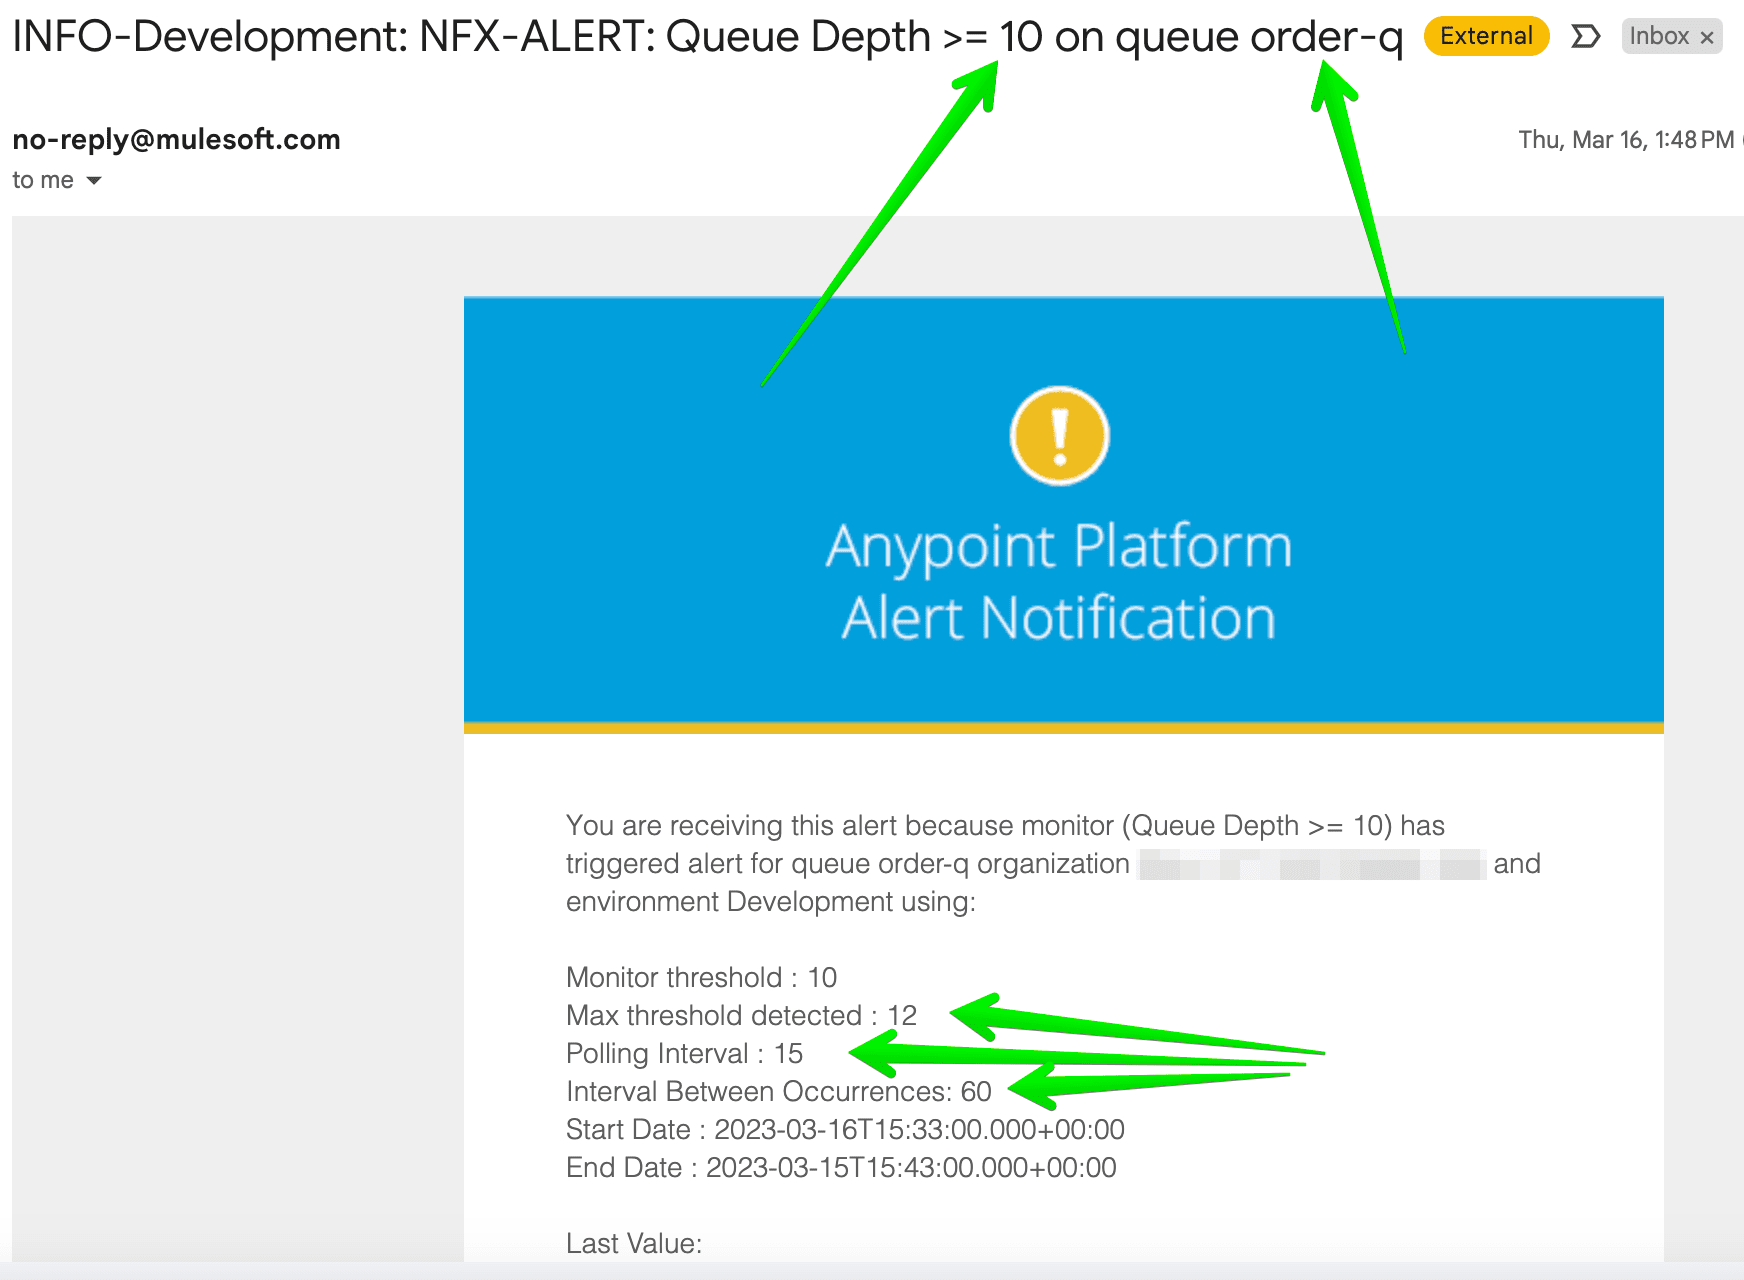
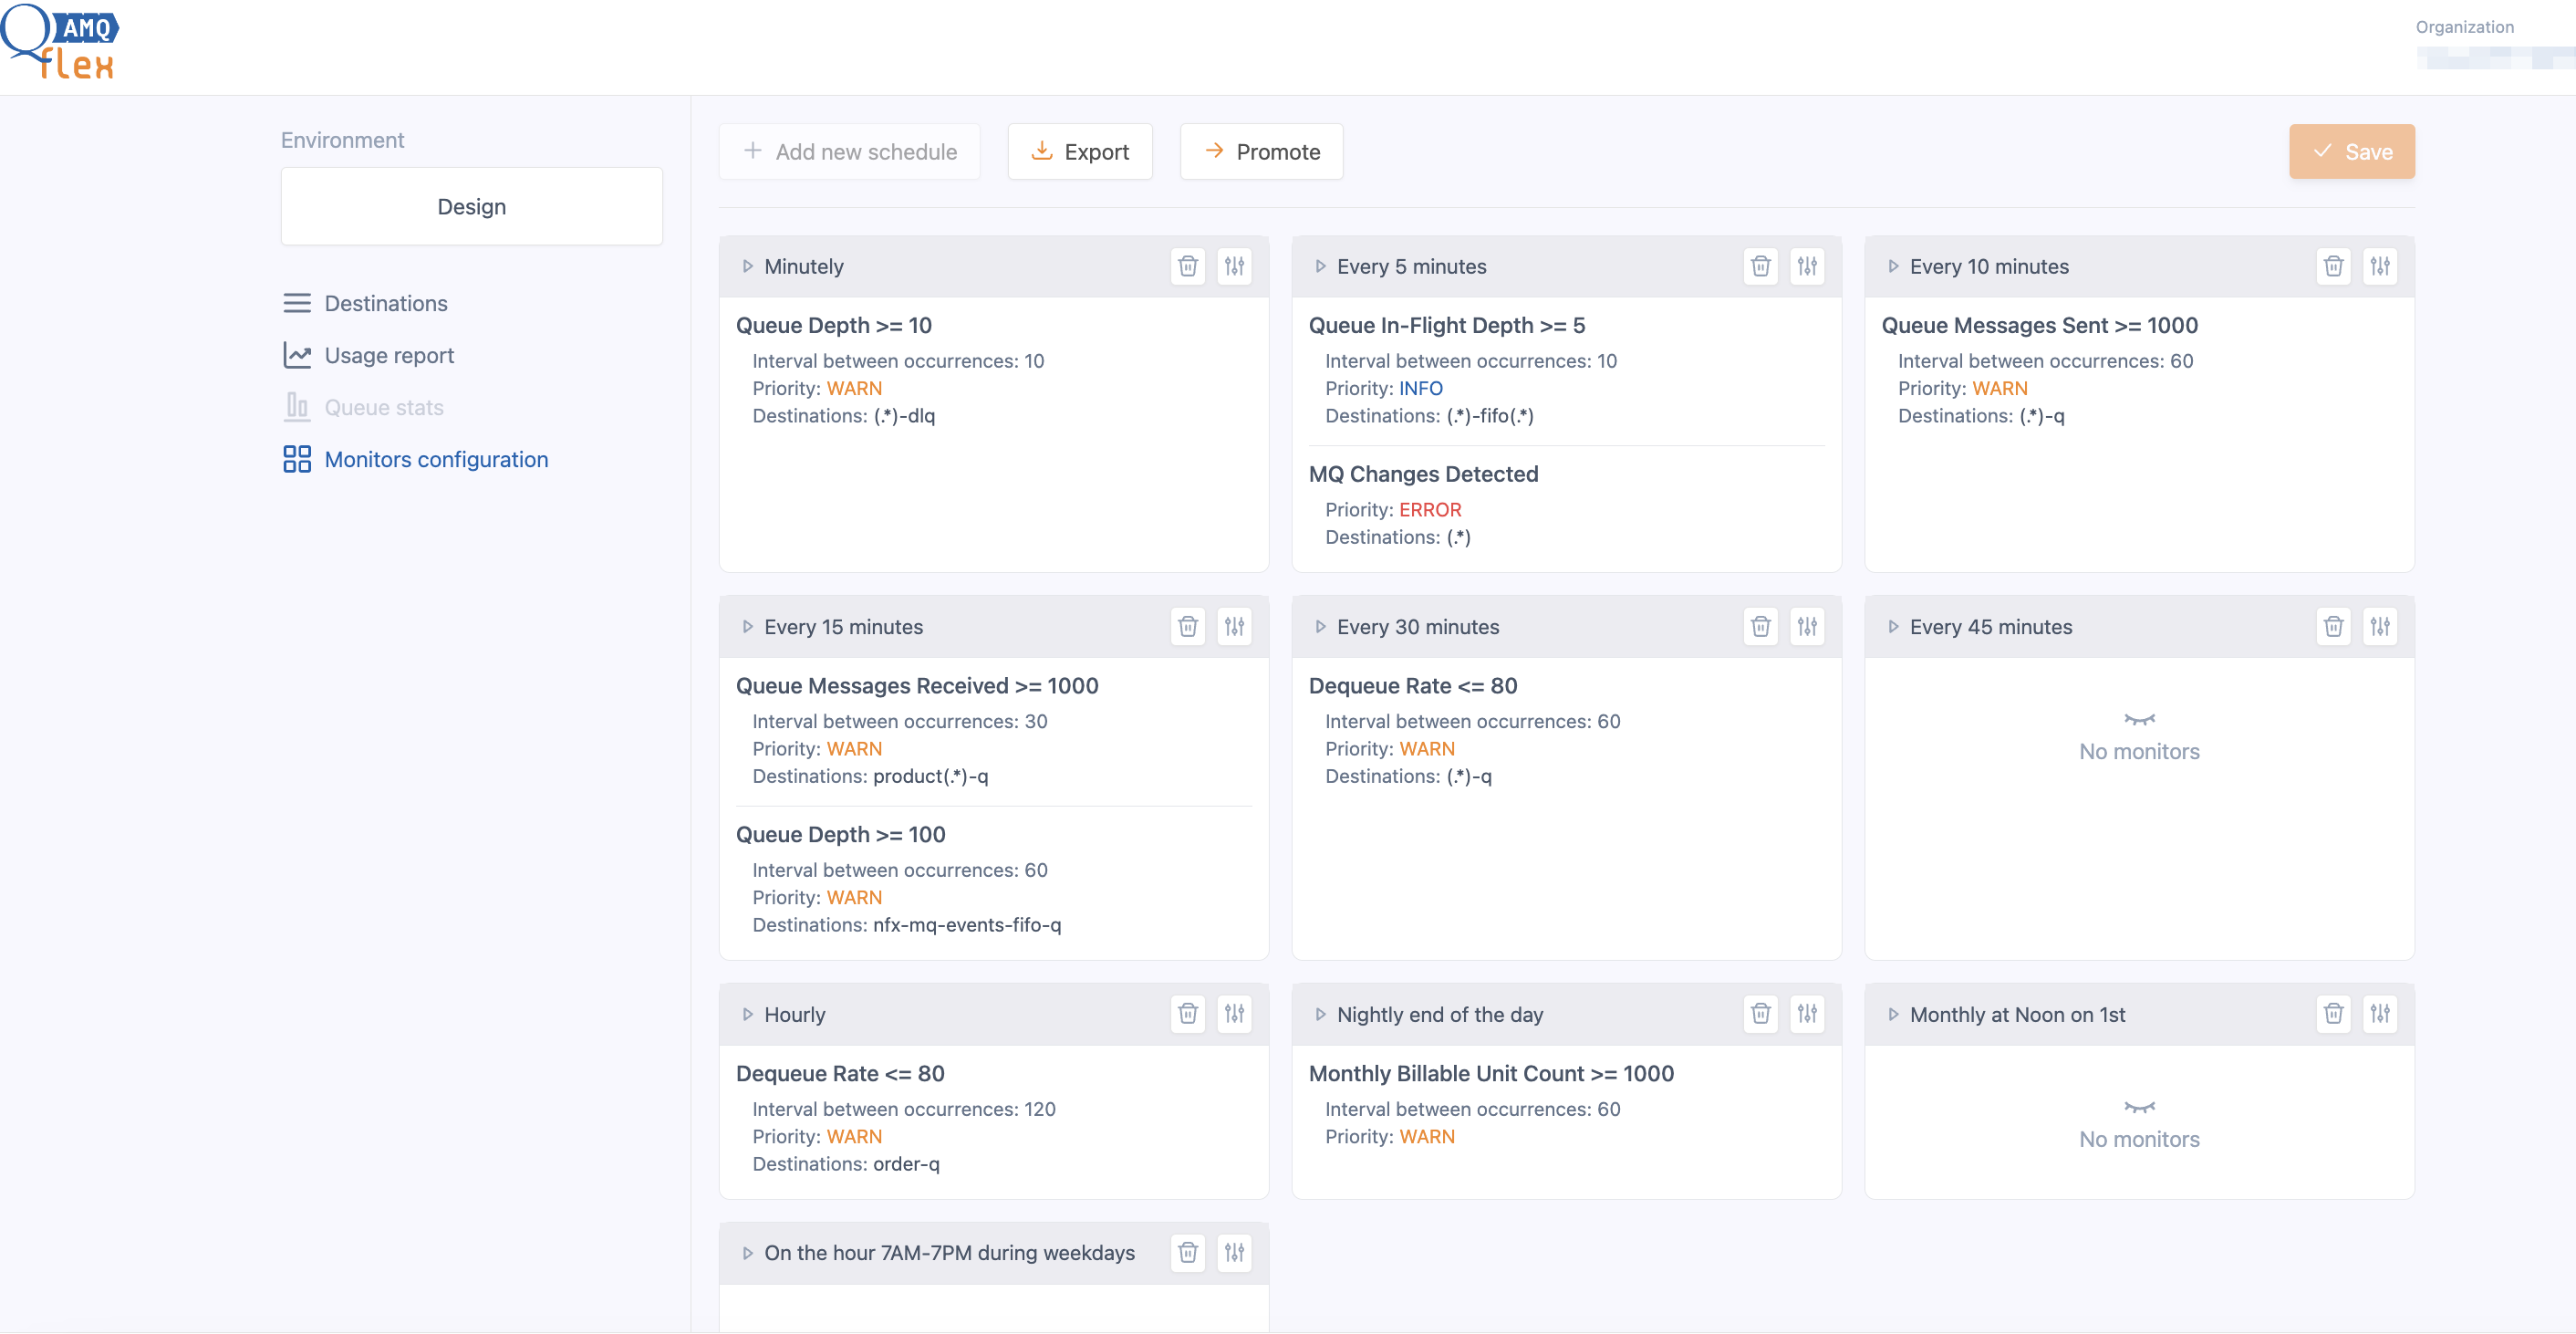
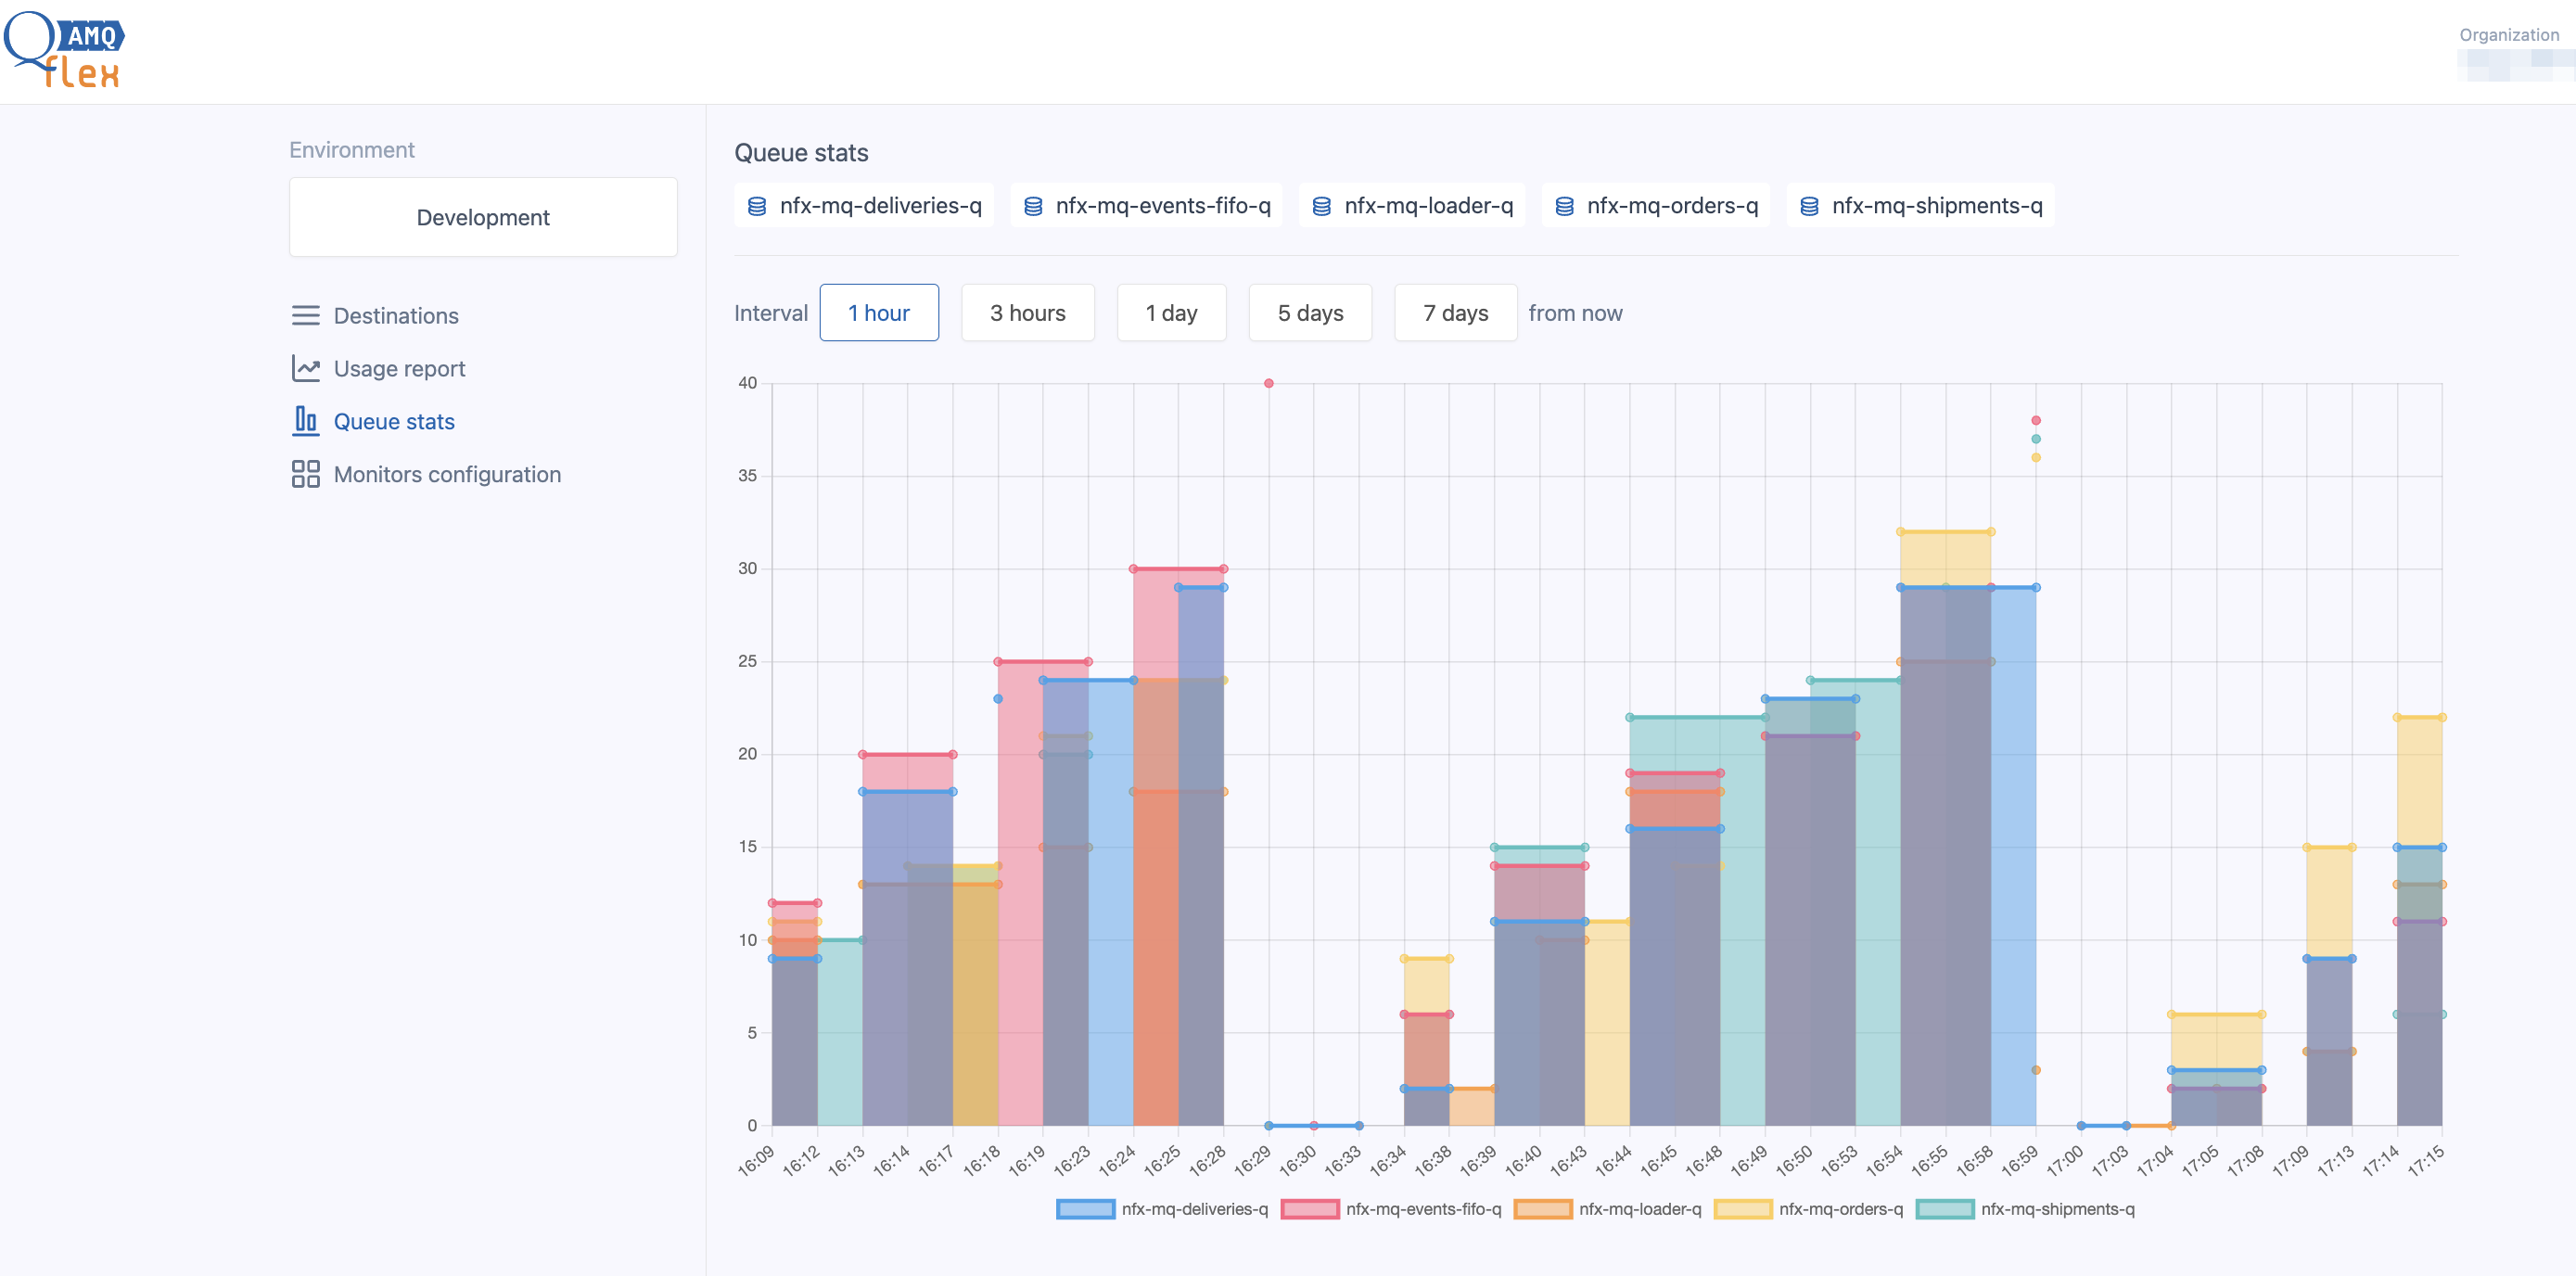
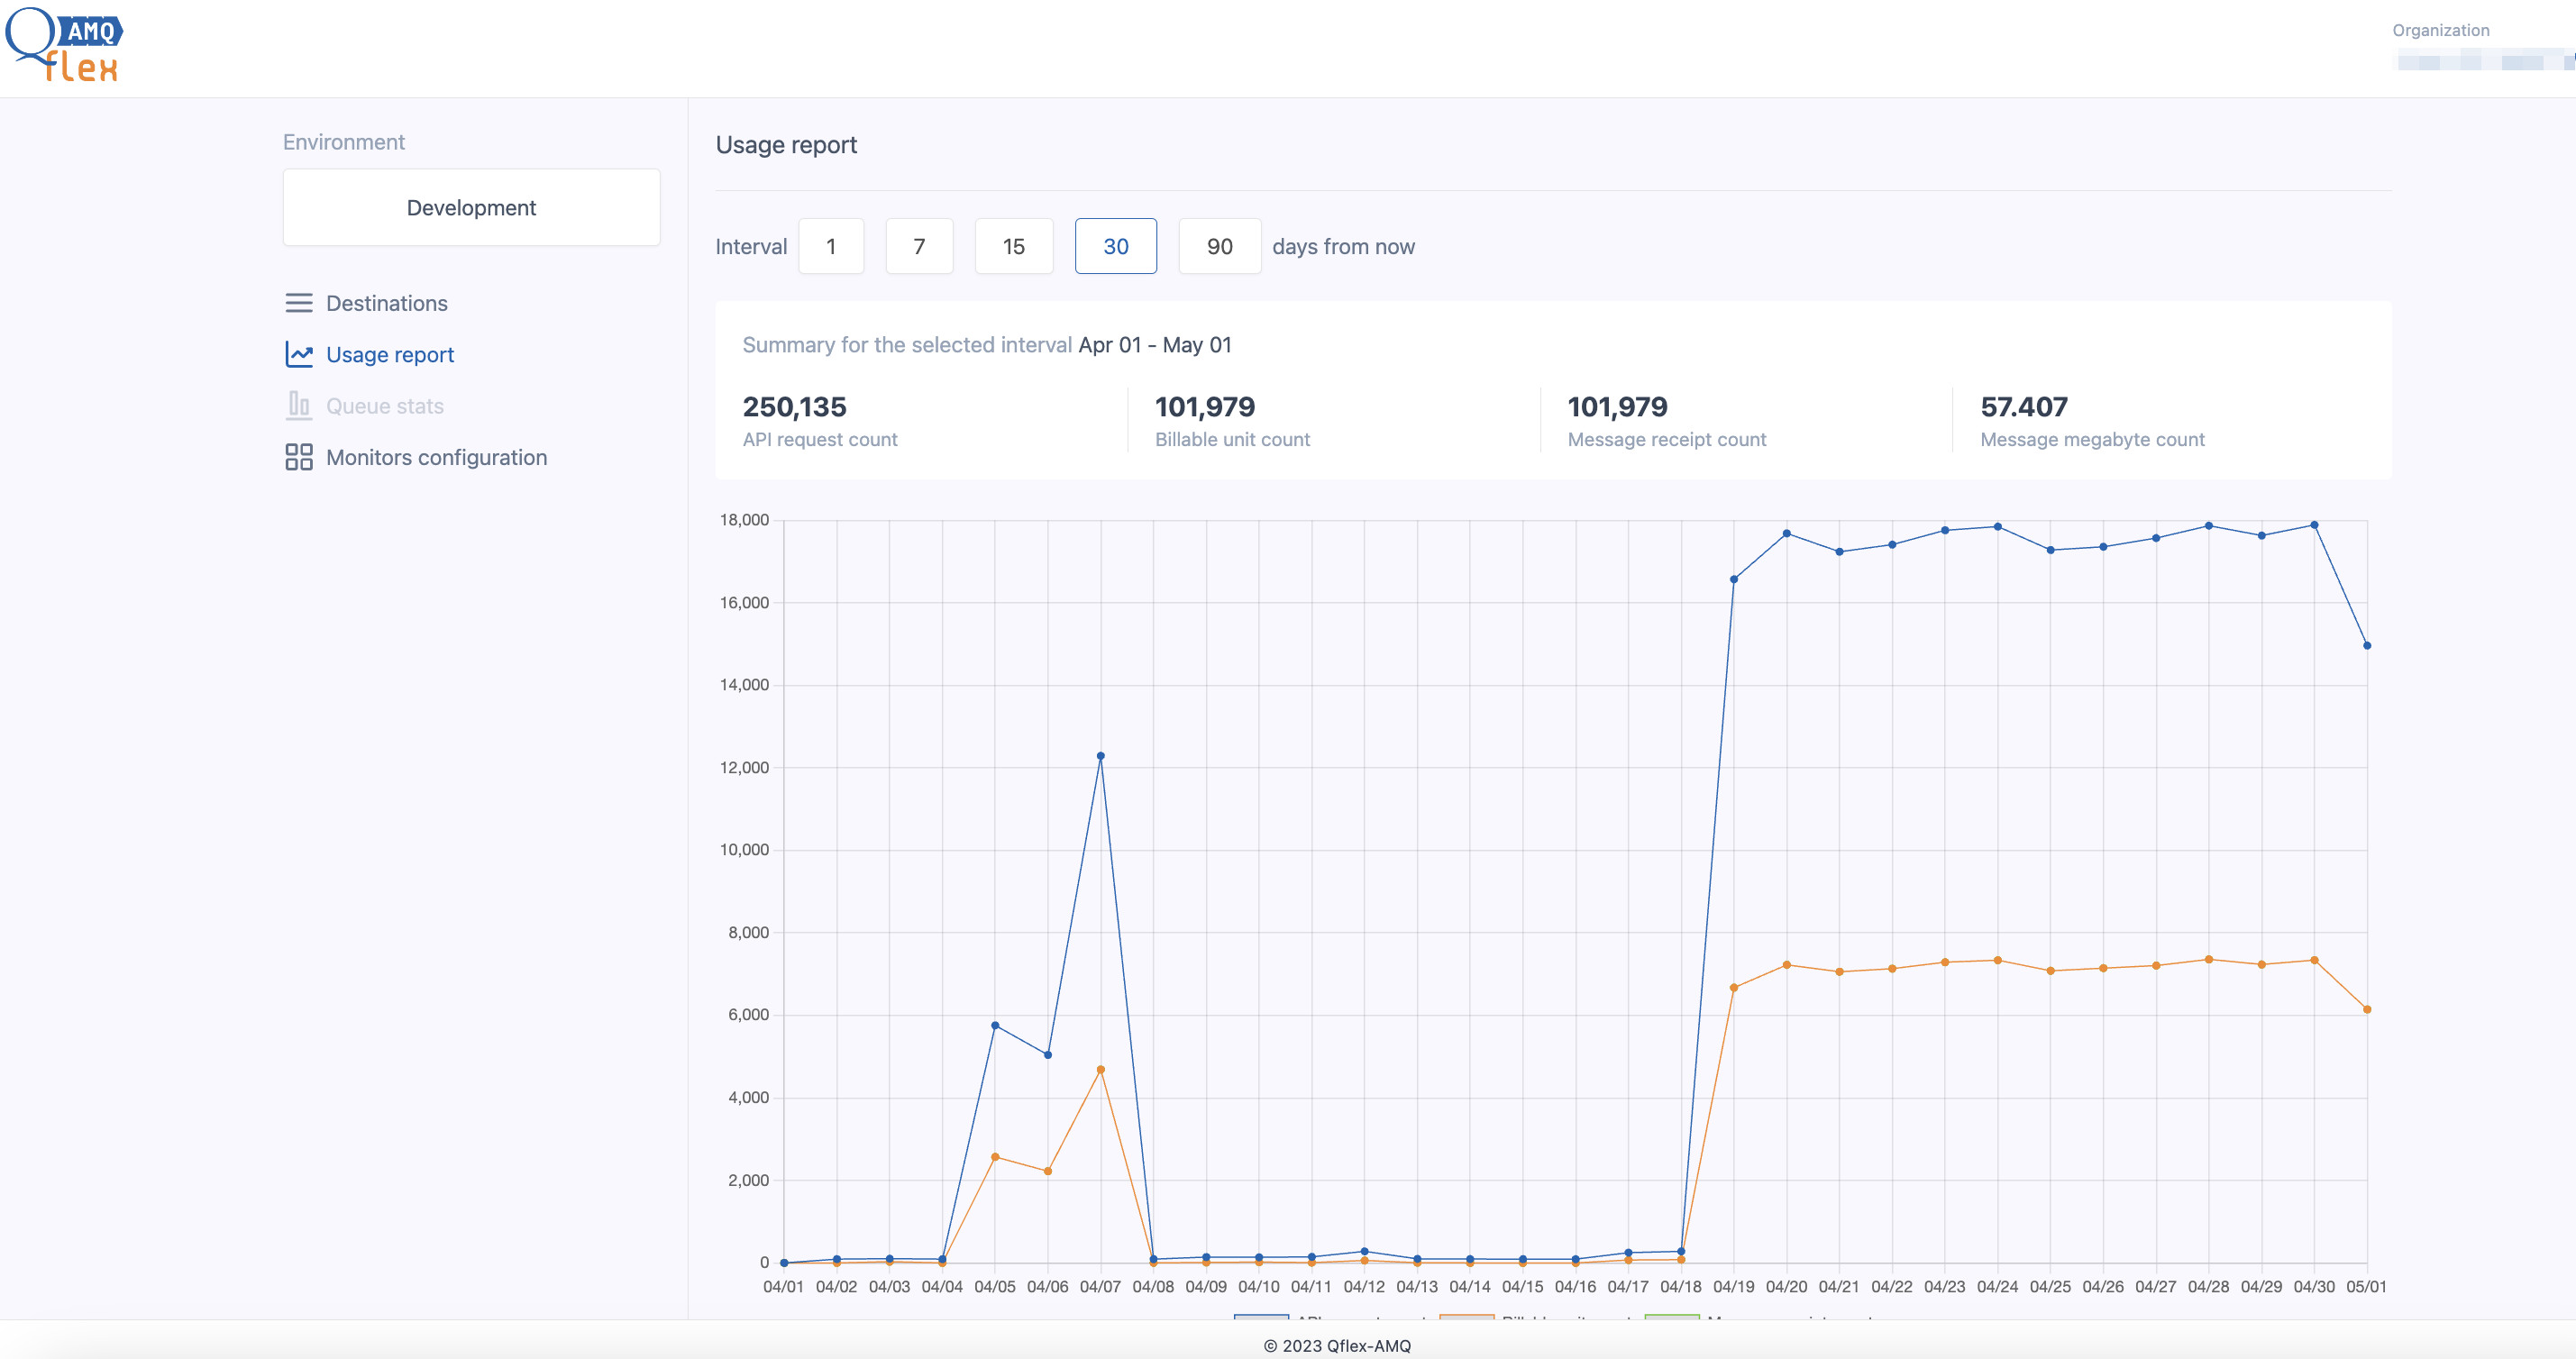
With Qflex-AMQ, you can gain real-time visibility into your messaging system and ensure seamless communication across your enterprise. Qflex-AMQ provides a comprehensive set of monitoring capabilities that enable you to keep a close eye on your messaging infrastructure. You can monitor message flows, identify bottlenecks, and troubleshoot issues before they impact your business operations. With Qflex-AMQ's customizable alerts and notifications, you can be notified of issues immediately and take action to resolve them. Qflex-AMQ provides detailed analytics and reporting features that offer insights into message delivery times, message volumes, and other critical metrics.

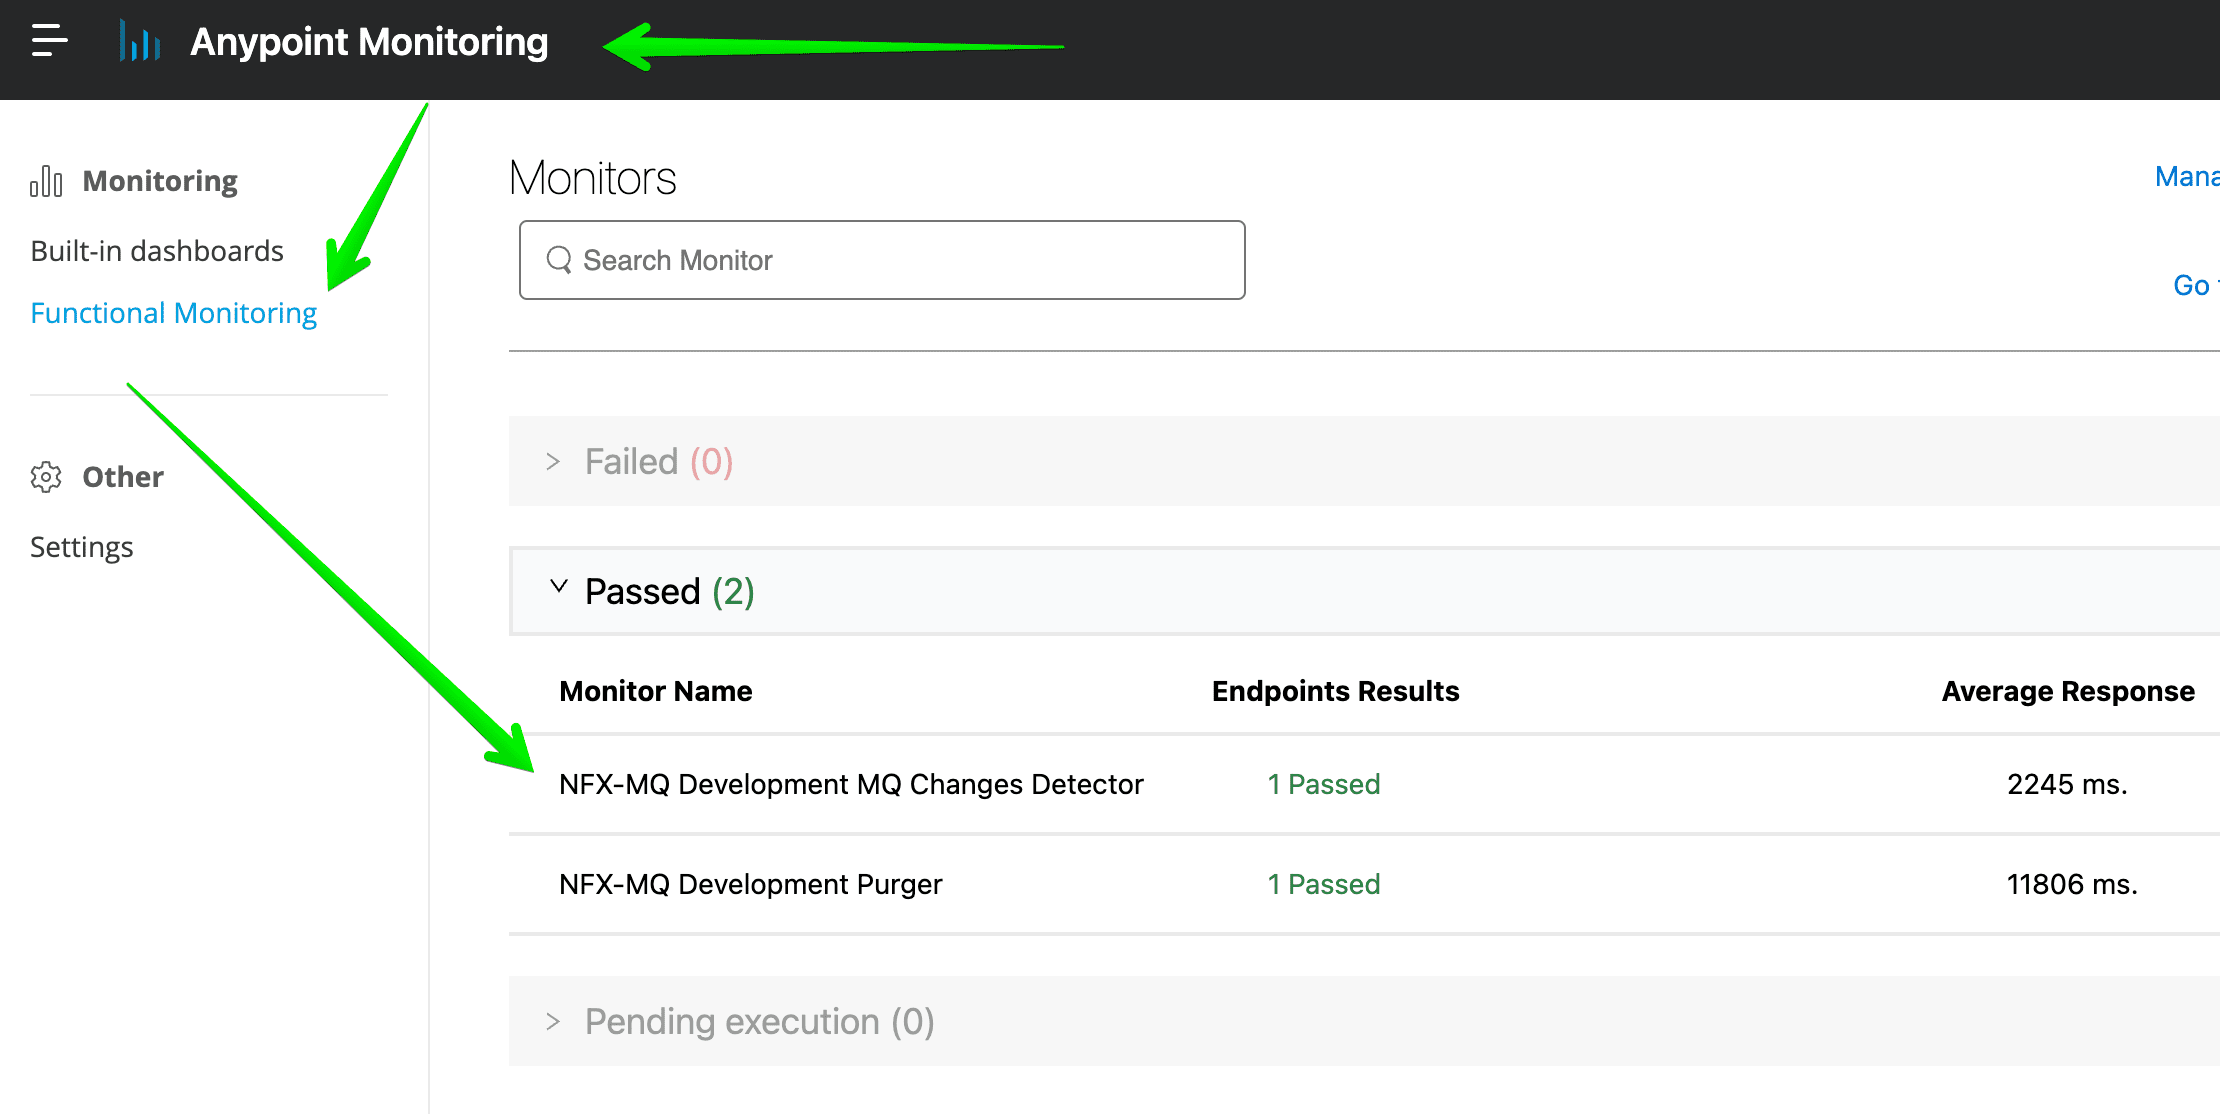
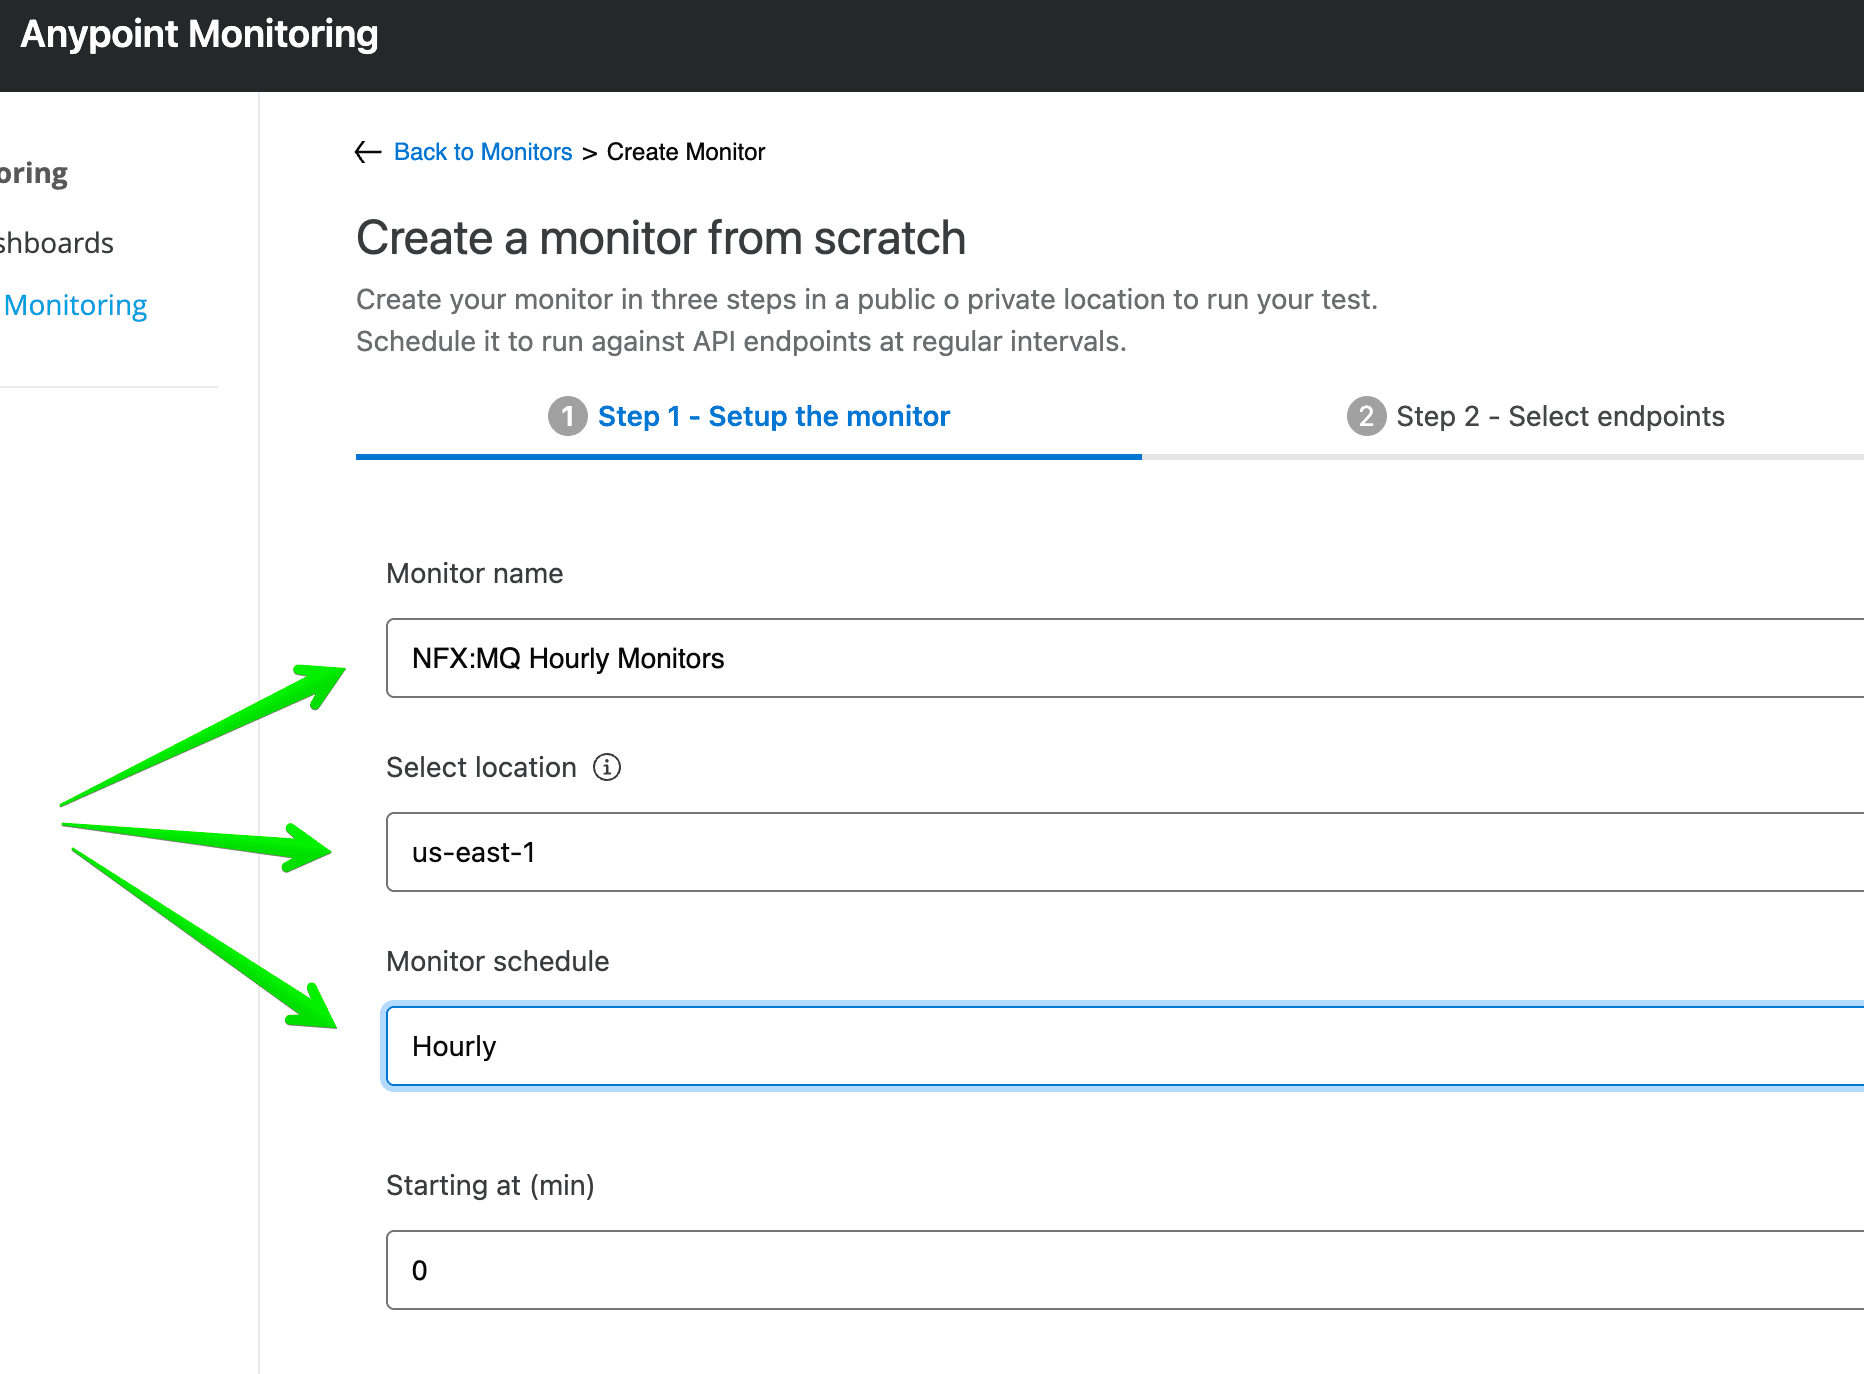
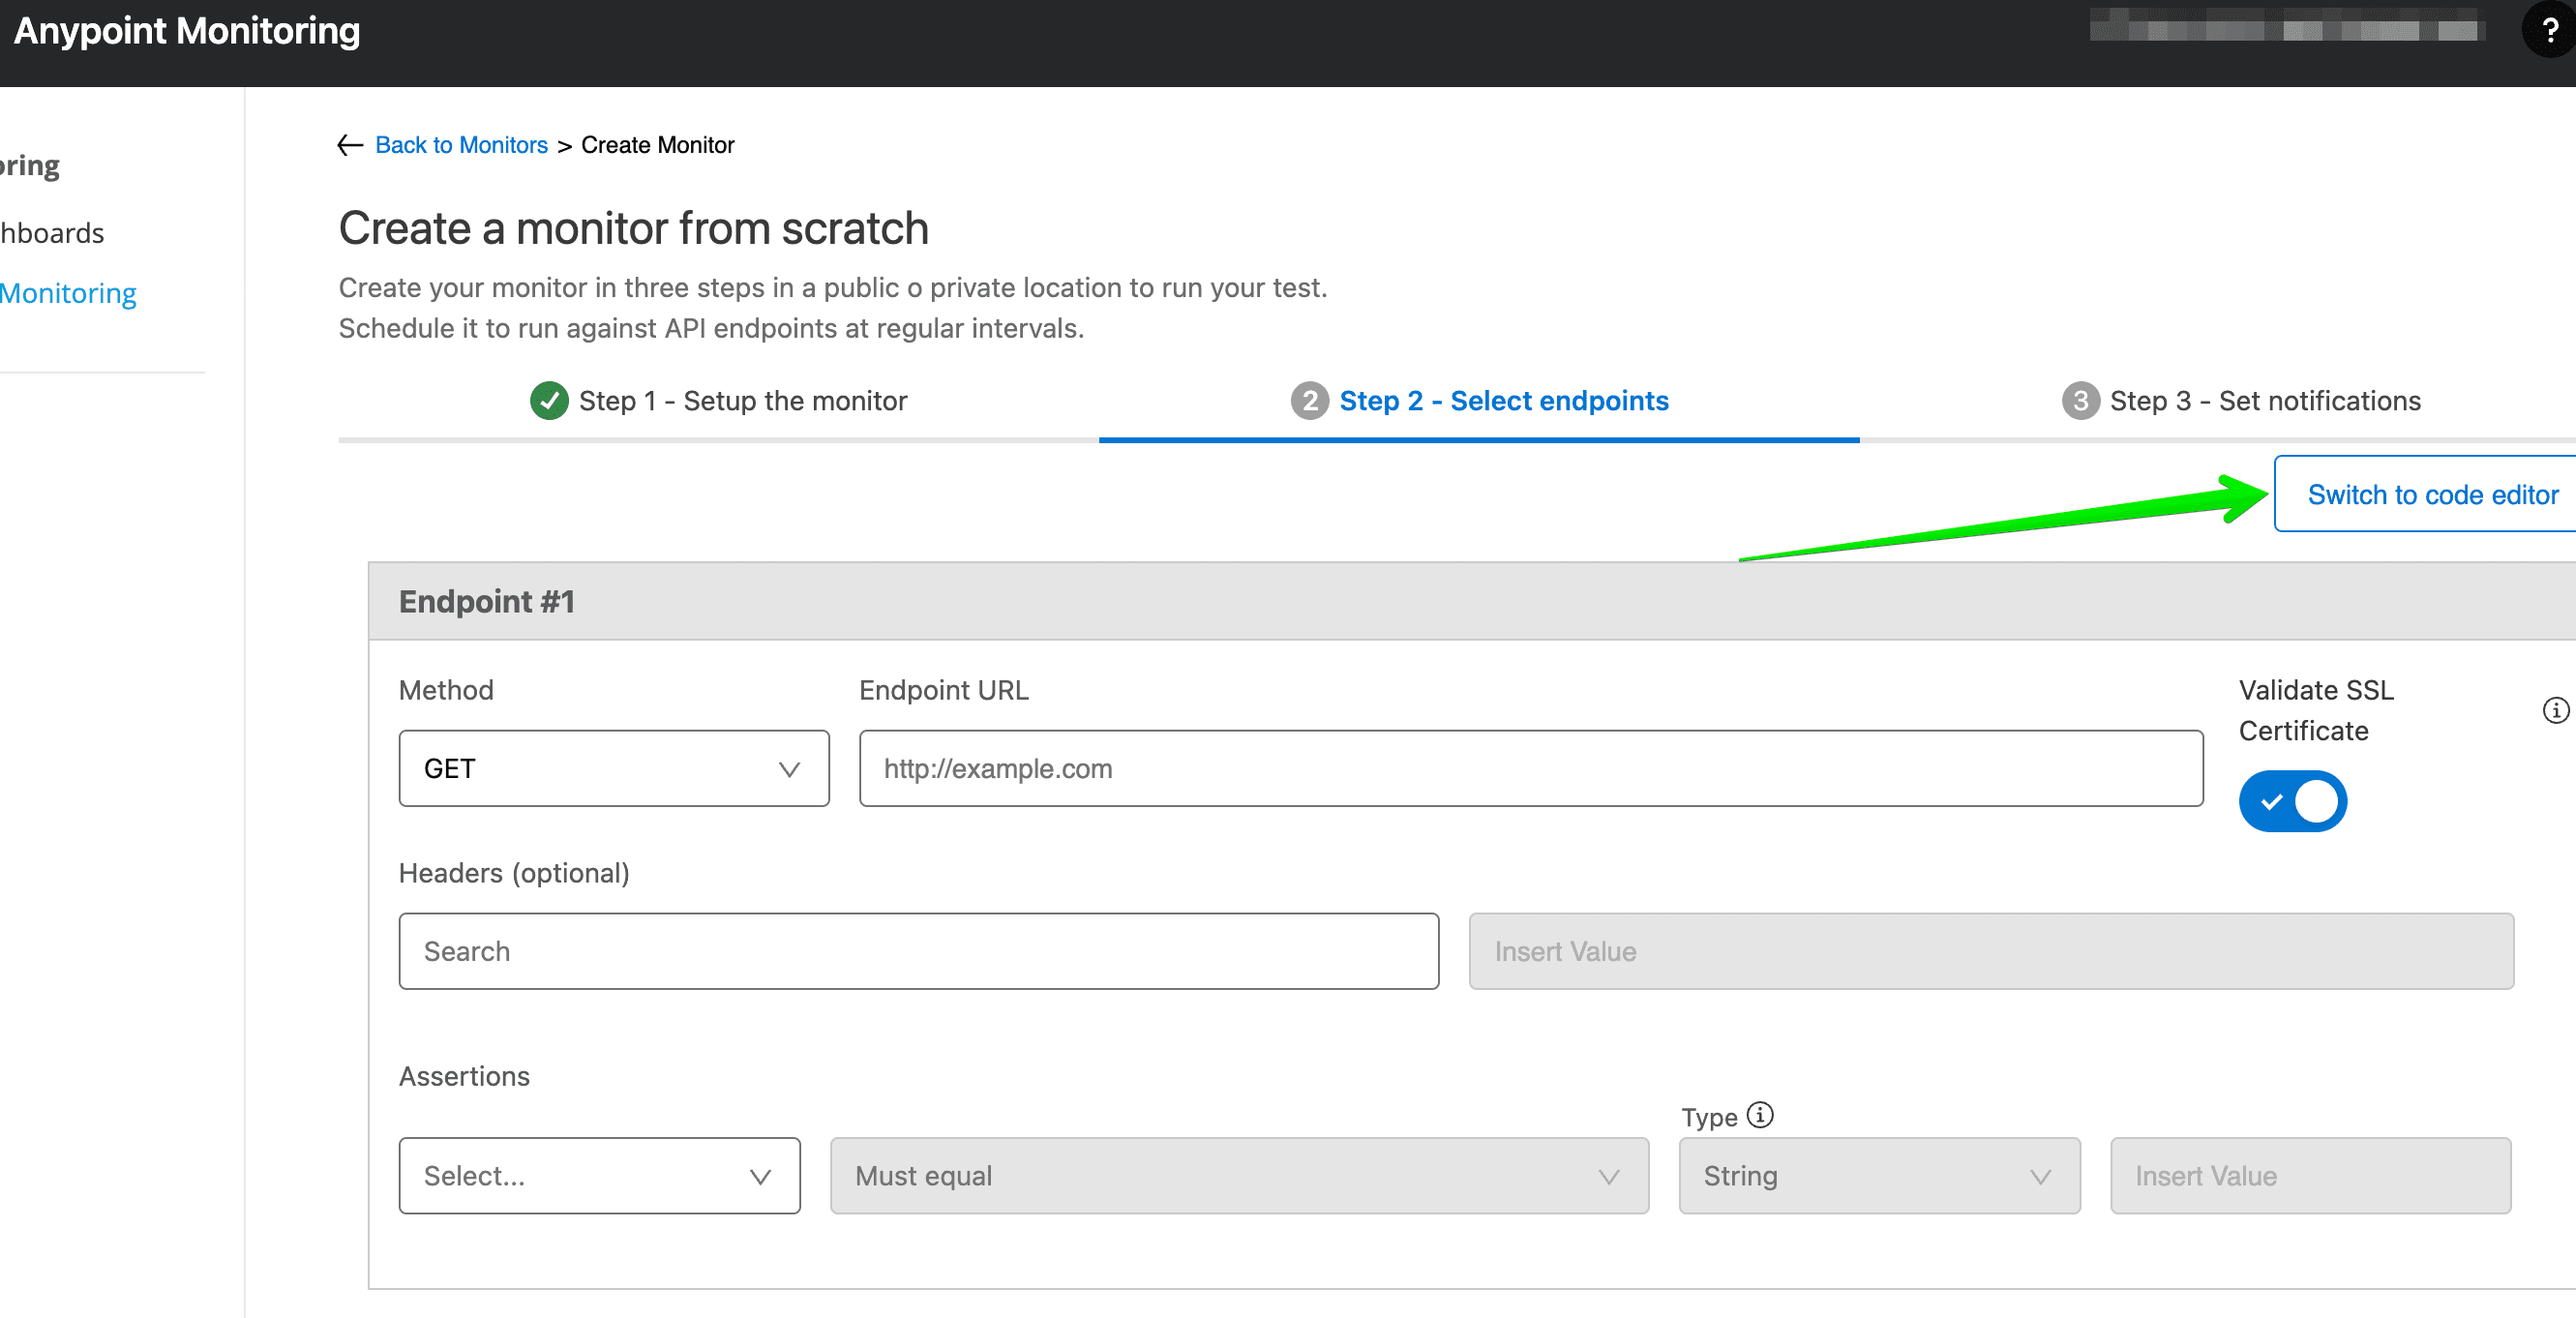
Qflex-AMQ is designed to integrate seamlessly with Mulesoft's Anypoint MQ messaging platform, ensuring that you can start monitoring your messaging infrastructure in no time. The software is easy to install, and you can customize it to suit your unique business requirements.

Whether you're a small business or a large enterprise, Qflex-AMQ is the ideal monitoring solution for Anypoint MQ.


Mulesoft Anypoint MQ Monitoring / v1.2.0 (Mule 4.9+ Java 17)

January 20, 2026

Download.jar Mule App

Qflex-AMQ Serial Number Request

Email with a Serial Number will be sent to the email account

Request

Management & Monitoring

Promote Queues Across Environments

Qflex-AMQ is a Mule 4.4 based API application that can run in CloudHub or On-Prem. For large Anypoint MQ deployments, we recommend using 0.2v-core worker size. Qflex-AMQ is an API and offers all monitors and utilities as endpoints.

Upon deployment, Qflex-AMQ will automatically generate all default Alerts in Runtime Manager for all the accessible environments within your organization's business group, set through the Properties during deployment.

We've designed Qflex-AMQ monitoring solution as a Mule-native application utilizing many aspects of Anypoint platform for managing notifications, monitor scheduling and etc.

Qflex-AMQ is an API with endpoints that contain functionality to monitor Anypoint MQ definition and configuration changes, monitor various aspects of specific queues, perform messages purging by moving all messages from one queue (typically dead letter queue) to another queue (typically replay queue).

Web UI Features:

  • Anypoint MQ Usage Monitoring and Reporting One of the key features of Qflex-AMQ is the ability to monitor your Anypoint MQ usage, both in terms of API calls and billable units used. With comprehensive usage monitoring and reporting, you'll have complete visibility into your Anypoint MQ costs, helping you optimize your consumption and avoid unexpected billing surprises.
  • Queue Statistics Reporting Across Multiple Destinations Qflex-AMQ takes queue monitoring to the next level by providing detailed statistics reporting across multiple destinations. You'll be able to monitor queue performance and usage across your entire Anypoint MQ environment, giving you the insights needed to make data-driven decisions on scaling, optimization, and overall performance management.
  • Enhanced Queue Details Screen with Message Activity Charts We've made significant improvements to the queue details screen in Qflex-AMQ, now including message activity charts. These visualizations allow you to quickly identify trends, patterns, and potential bottlenecks in your Anypoint MQ environment. With an enhanced view of message activity, you'll be better equipped to address issues proactively and keep your messaging system running smoothly.
  • UI for Monitoring and SchedulingMakes it easy and intuitive to setup monitors and even promote to other environments to save on time.
  • Purge Queue (move all messages off the queue to any target queue)
  • Export queue contents without consuming messages.
  • Move and publish messages between queues.
View Destination Details here

Sample URL to access Web UI:

http://xxx-anypoint-mq-api-dev.us-e2.cloudhub.io/?client_id=XXXXX&client_secret=YYYYY

Monitoring Features:

  • Queue Depth >= and Queue Depth <=
  • Queue In-Flight Count >= and Queue In-Flight Count <=
  • Queue Messages Sent Count >= and Queue Messages Sent Count <=
  • Queue Dequeue Rate Less Than %
  • Stale Messages
  • MQ Changes Detected
  • Monthly Billable Unit Count >=

Queue Depth

The number of messages processed through the queue during the period from (now - polling interval) to now.

Queue In-Flight Messages

The number of messages currently locked and processing from the queue during the period from (now - polling interval) to now.

Anypoint MQ FIFO queues supports up to 10 in-flight messages in each message group thus it's important to keep track of the in-flight depth of FIFO queues.

Queue Messages Sent

The number of messages published to the queue during the period from (now - polling interval) to now.

Queue Messages Received

The number of messages consumed from the queue during the period from (now - polling interval) to now.

Dequeue Rate

The rate at which messages are removed/consumed from the queue as opposed to the rate at which queue is getting filled on time interval from (now - polling interval) to now.

MQ Changes Detected

Triggered by finding Anypoint MQ changes in audit logs based on time interval from (now - polling interval) to now.

This information is import to keep track of in case of unexpected changes to production definitions of your queues and exchanges to prevent critical issues before they happen.

Common Parameters

Parameter Name Purpose
Criticality Failure, Warning, Problem or Info.
Notification Methods Cloudhub Notifications, supporting email and slack notifications.
Email Recipients Required only for ’email’ method.
Triggering Condition Threshold For example, to set up a monitor that checks if queue depth is over 10, monitor should be Queue Depth >= and threshold parameter of 10. For some monitors like MQ Changes Detected this field is irrelevant.
Interval between Occurrences (minutes) Allows to ignore subsequent occurrences of the alarm for a specified period of time, after monitoring condition occurred for the first time.
Example: Monitor A has Polling Interval set to 1 minute and Interval Between Occurrences is set to 5 minutes. After application notices that the condition has occurred for the first time, it will send an alarm. However, it will not send another alarm until 5 minutes have elapsed, provided during that time condition remained true.
Polling Interval (minutes) Controls frequency with which monitored condition is checked. Minimal value is 1 minute.
NOTE: This value is set from Functional Monitoring
Resolution Instructions Provides a way to customize messages for each monitor. You are encouraged to use this field to instruct your DevOps staff about handling of this alarm. You can use all the custom tags that are used in Alert Text.

Prerequisites:

Must have 0.2 v-core available in the targeted CloudHub environments. Although we run all our tests against 0.1v-core without any issues we do recommend 0.2v-cores for any application running in CloudHub.

Installation:

Deploy Qflex-AMQ application .zip to any environment using any naming convention. There is no need to deploy more than 1 instance of Qflex-AMQ application in order to monitor all of your Anypoint MQ environments. Environment as well as organization name is configurable within the monitor itself using corresponding names (ids will be automatically discovered using Anypoint profile endpoint). Once application is up and running, it will initiate creation of all alerts within the default environment (only in beta version, release will propagate the changes to all environments).

CloudHub Properties:

anypoint.platform.config.analytics.agent.enabled=true
anypoint.platform.client_id=[TARGET ANYPOINT ENVIRONMENT ID]
anypoint.platform.client_secret=[TARGET ANYPOINT ENVIRONMENT SECRET]
mule.env=local
mule.key=1234567890
api.apiId=[EITHER SETUP NEW API in API MANAGER or USE 1]
anypoint.platform.gatekeeper=[disabled WHEN USING 1 ABOVE]
app.category=com.netflexity.amq
anypoint.defaults.organizationName=[Case-sensitive Business Group Name]
anypoint.defaults.environmentName=[Optional default environment name, defaults to Development]
anypointmq.region=us-east-1
secure\:\:cloudhub.client_id=[CONNECTED APP ID (see setup below)]
secure\:\:cloudhub.client_secret=[CONNECTED APP SECRET (see setup below)]
smtp.host=smtp.gmail.com (OPTIONAL SMTP server details to receive queue reports)
smtp.port=465
smtp.to=[(OPTIONAL COMMA-DELIMITED EMAIL LIST]
smtp.default.from.address=[(OPTIONAL FROM ADDRESS]
secure\:\:smtp.username=[(OPTIONAL SMTP USERNAME]
secure\:\:smtp.password=[(OPTIONAL SMTP PASSWORD]
web.external.host=[FULL APP HOST NAME](example, nfx-anypoint-mq-api-dev.us-e2.cloudhub.io)

CloudHub Connected App Setup:

Setup Connected App for Qflex-AMQ application under Access Management using all scopes outlined in the Setup Connected App Qflex-AMQ

Alert Setup:

Upon application start up, you will find the following alerts generated in your default environment (set through CloudHub properties above). Note, these are provided as templates and can be further modified per your organization’s conventions.

nfx mq default alerts

Email examples

email alert mq changes detected email alert q depth

Monitoring and Scheduling Setup:New Feature

Discover the powerful new features and enhanced UI designed to elevate your user experience and streamline your messaging environment.

  1. Enhanced User Interface: Our redesigned UI offers an intuitive, user-friendly experience. Effortlessly navigate and access the information you need in a visually engaging layout.
  2. Comprehensive Monitoring and Reporting: Qflex-AMQ now delivers extensive monitoring capabilities, including real-time data, historical analysis, and customizable alerts to keep you informed and in control of your messaging infrastructure.
  3. Performance Optimization: Monitor and manage Anypoint MQ performance with insightful metrics, allowing for proactive issue identification and resolution to keep your system running smoothly.
  4. Seamless Integration: Qflex-AMQ integrates seamlessly within your Anypoint, ensuring a smooth transition and minimal disruption to your current workflows.
Configure your Anypoint MQ monitors here View Queue Stats Reports here View Usage Reports here

Functional Monitoring Setup: (OPTIONAL: Use Web UI)

We are going to utilize functional monitors as a scheduling tool for invoking Qflex-AMQ monitors so you can add as many endpoints to a single monitor that satisfied your polling interval. For example, you can setup all the monitors to run on hourly basis thus needing only a single functional monitor setup.

nfx mq functional monitors setup
  1. Create new monitor by pressing Create Monitor in the top right corner.
  2. Give any desired name.
  3. Select proper location (private location in case of DLB)
  4. Select monitor schedule (hourly as an example)
  5. On the next screen, switch to Code Editor and use one of the provided examples below or setup endpoints manually.
  6. Click Next and skip notifications by pressing Create Monitor (we don't need notifications since these functional monitors will be utilized as smart schedulers for Qflex-AMQ monitoring needs).

functional monitor step 1 functional monitor step 2

Functional Monitoring Templates: (OPTIONAL: Use Web UI)

Below you will find monitor templates to be used in the functional monitors code editor.

  • Queue Depth >= and Queue Depth <=
  • Queue In-Flight Count >= and Queue In-Flight Count <=
  • Queue Messages Sent Count >= and Queue Messages Sent Count <=
  • Queue Messages Received Count >= and Queue Messages Received Count <=
  • Queue QoS Dequeue Rate Less Than %
  • Stale Messages
  • MQ Changes Detected
  • Queue Message Mover (Cut from queue X and Push to target queue Y)