We’ve developed this monitoring application for Anypoint MQ to fill in the missing important monitoring functionality, which is typically necessary when using industry standard enterprise-level message oriented middleware systems like IBM MQ.
About:
NFX-AMQ is a Mule 4.4 based API application that can run in CloudHub or On-Prem. For large Anypoint MQ deployments, we recommend using 0.2v-core worker size. NFX-AMQis an API and offers all monitors and utilities as endpoints.
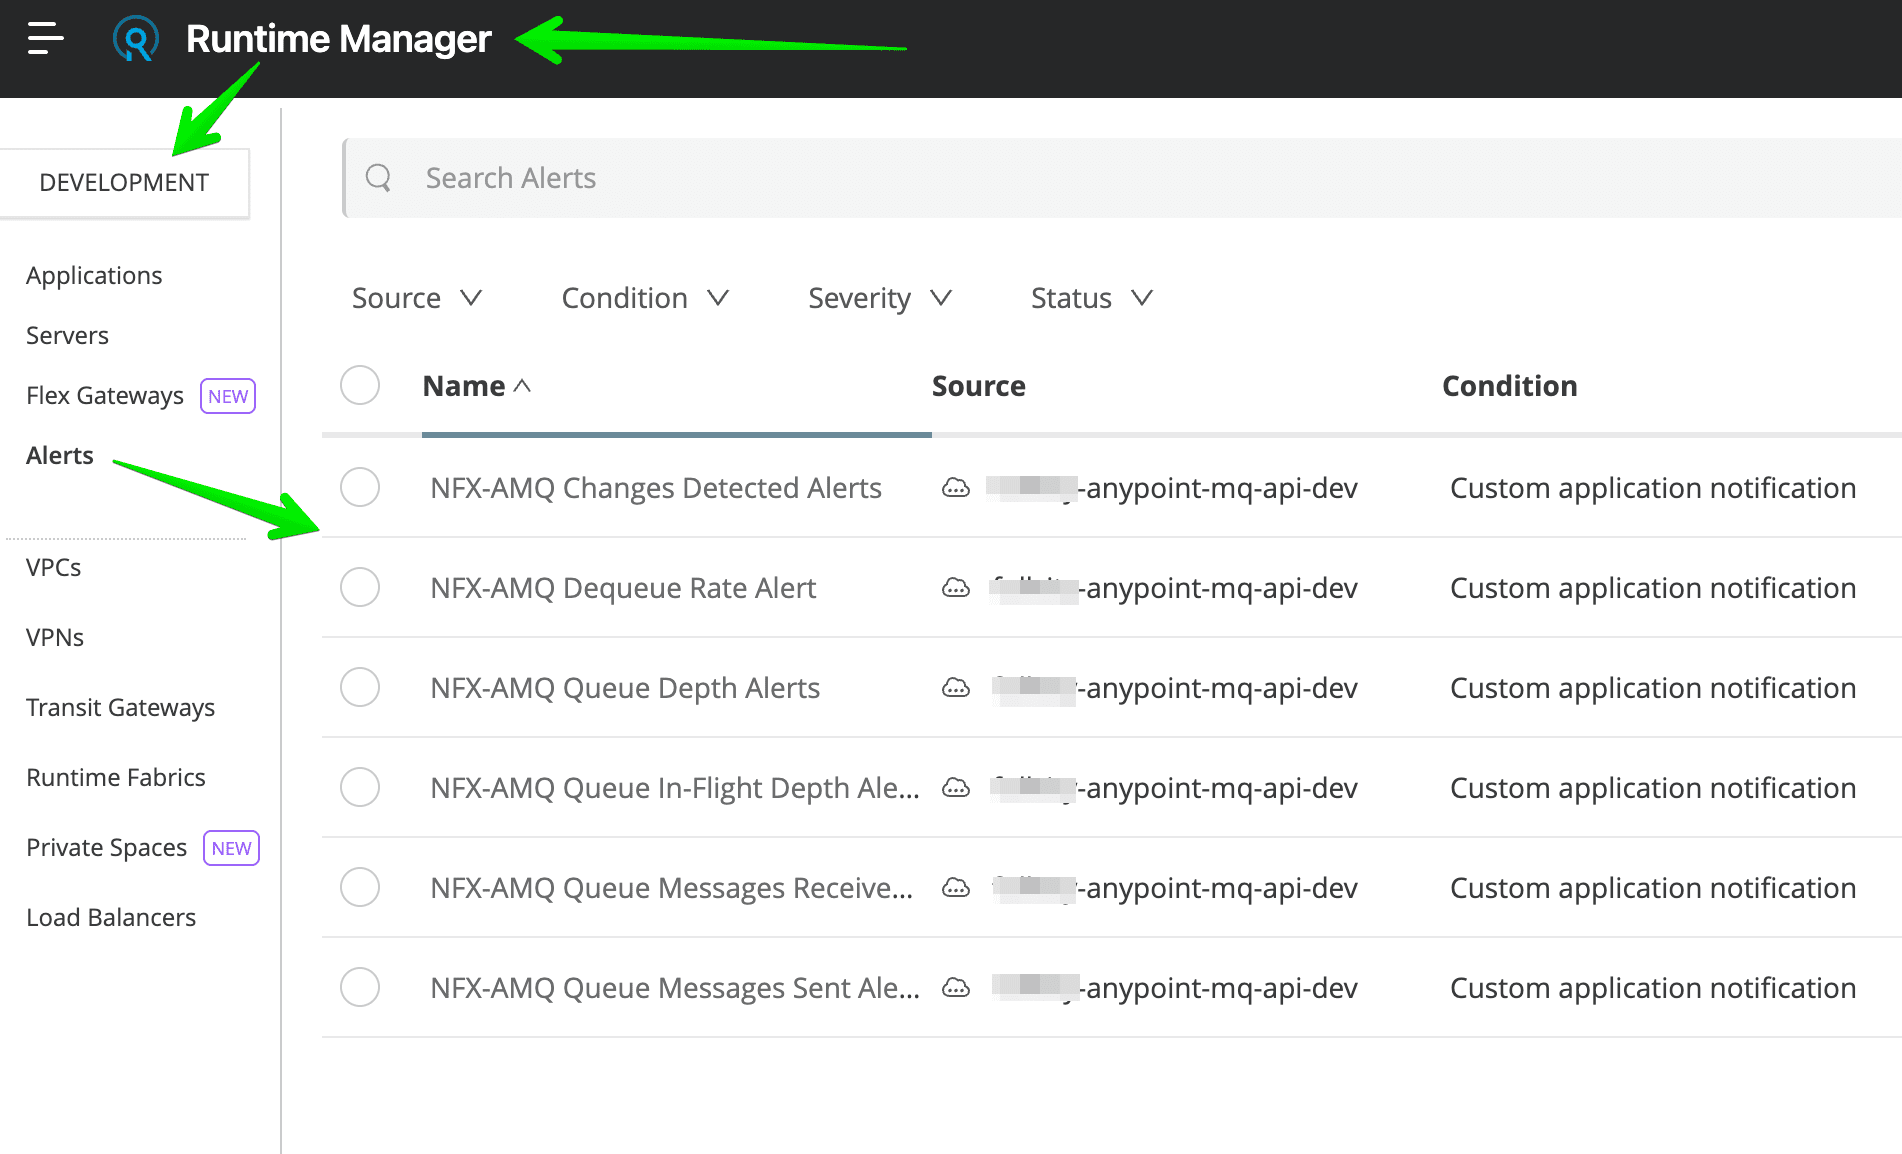
Upon deployment, NFX-AMQ will automatically generate all default Alerts in Runtime Managerfor the default environment of your organization, set through the Properties during deployment.
Approach:
We’ve designed NFX-MQ monitoring solution as a Mule-native application utilizing many aspects of Anypoint platform for managing notifications, monitor scheduling and etc.
NFX-MQ is an API with endpoints that contain functionality to monitor Anypoint MQ definition and configuration changes, monitor various aspects of specific queues, perform messages purging by moving all messages from one queue (typically dead letter queue) to another queue (typically replay queue).
MQ Utility Features:
- Purge Queue (move all messages off the queue to any target queue)
- Export queue contents without consuming messages.
- Move and publish messages between queues.
Monitoring Features:
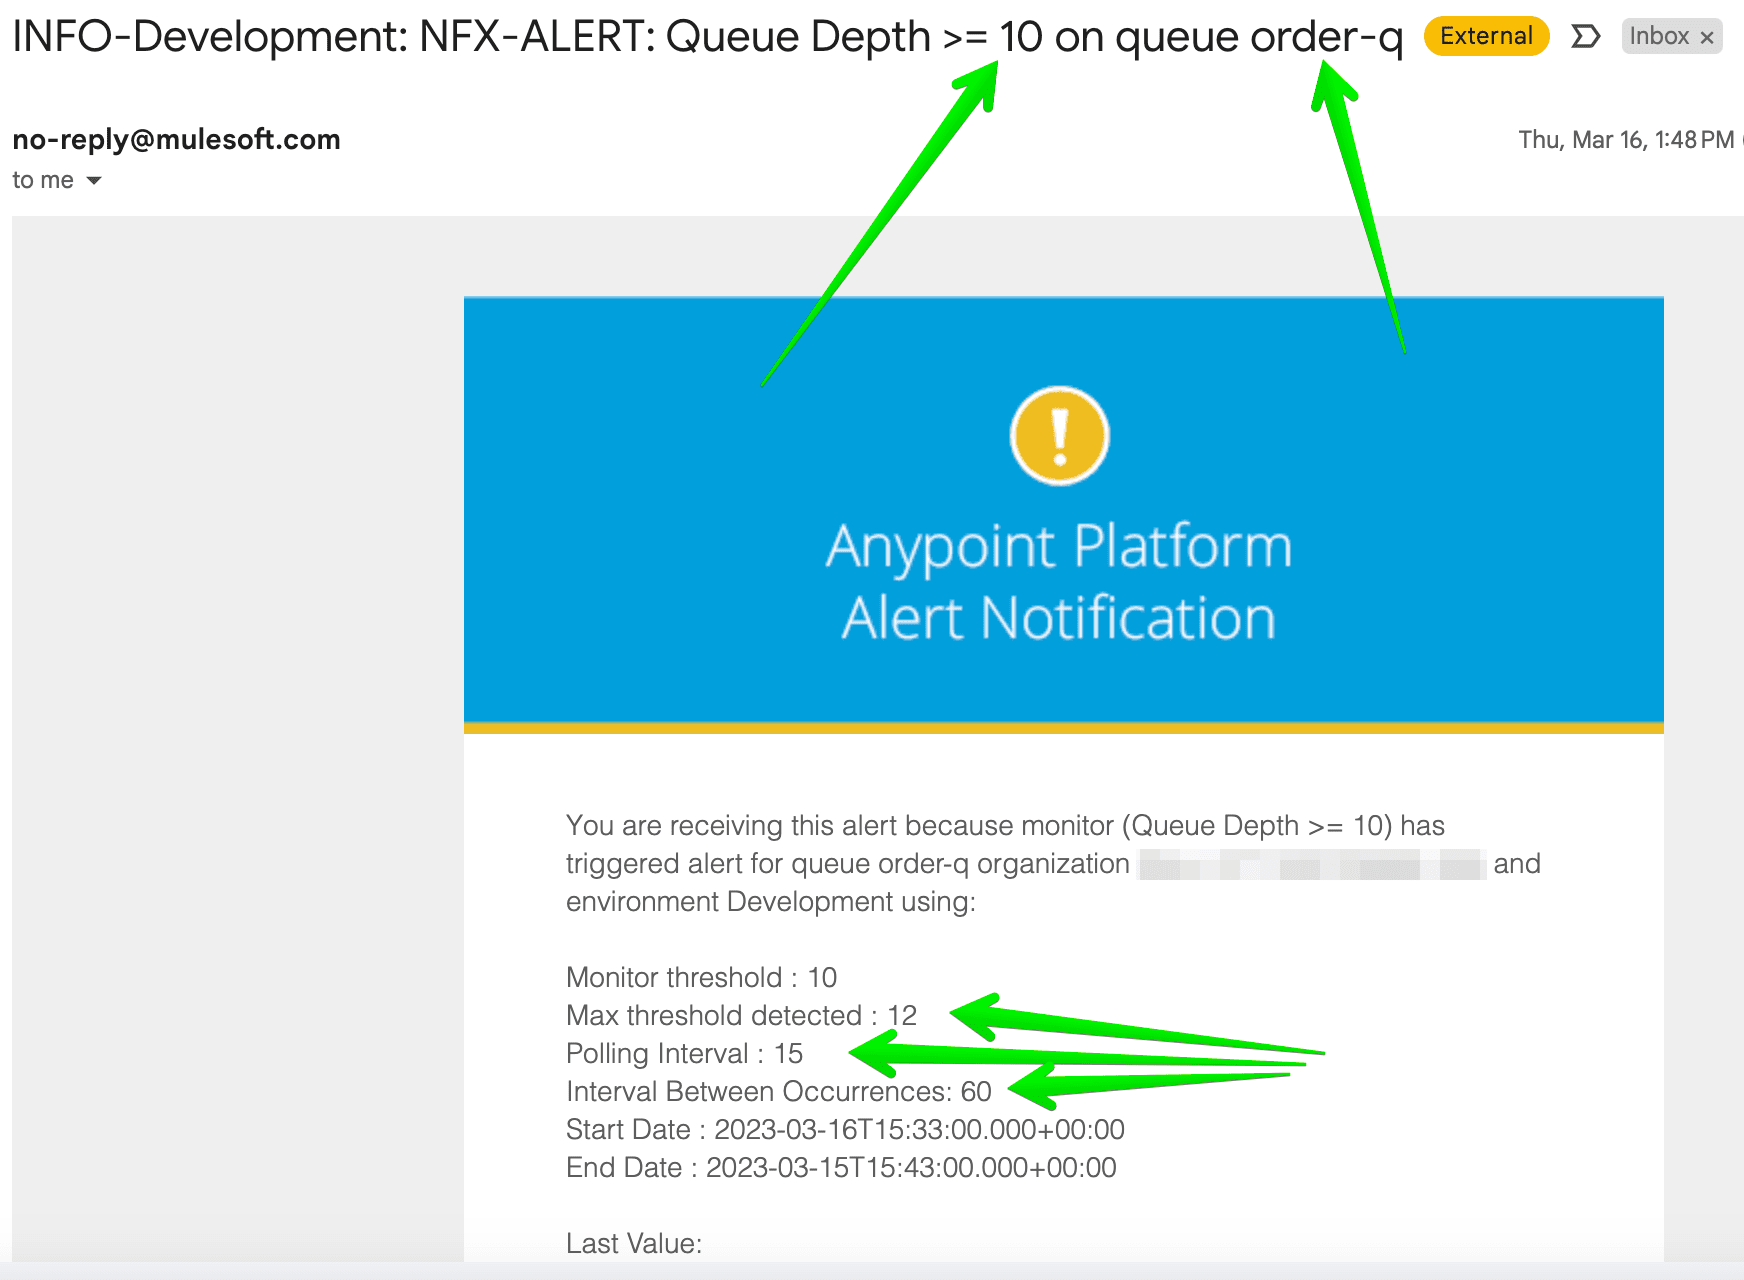
- Queue Depth >= and Queue Depth <=
- Queue In-Flight Count >= and Queue In-Flight Count <=
- Queue Messages Sent Count >= and Queue Messages Sent Count <=
- Queue Dequeue Rate Less Than %
- Stale Messages
- MQ Changes Detected
Queue Depth
The number of messages processed through the queue during the period from (now – polling interval) to now.
Queue In-Flight Messages
The number of messages currently locked and processing from the queue during the period from (now – polling interval) to now.
Anypoint MQ FIFO queues supports up to 10 in-flight messages in each message group thus it’s important to keep track of the in-flight depth of FIFO queues.
Queue Messages Sent
The number of messages published to the queue during the period from (now – polling interval) to now.
Queue Messages Received
The number of messages consumed from the queue during the period from (now – polling interval) to now.
Dequeue Rate
The rate at which messages are removed/consumed from the queue as opposed to the rate at which queue is getting filled on time interval from (now – polling interval) to now.
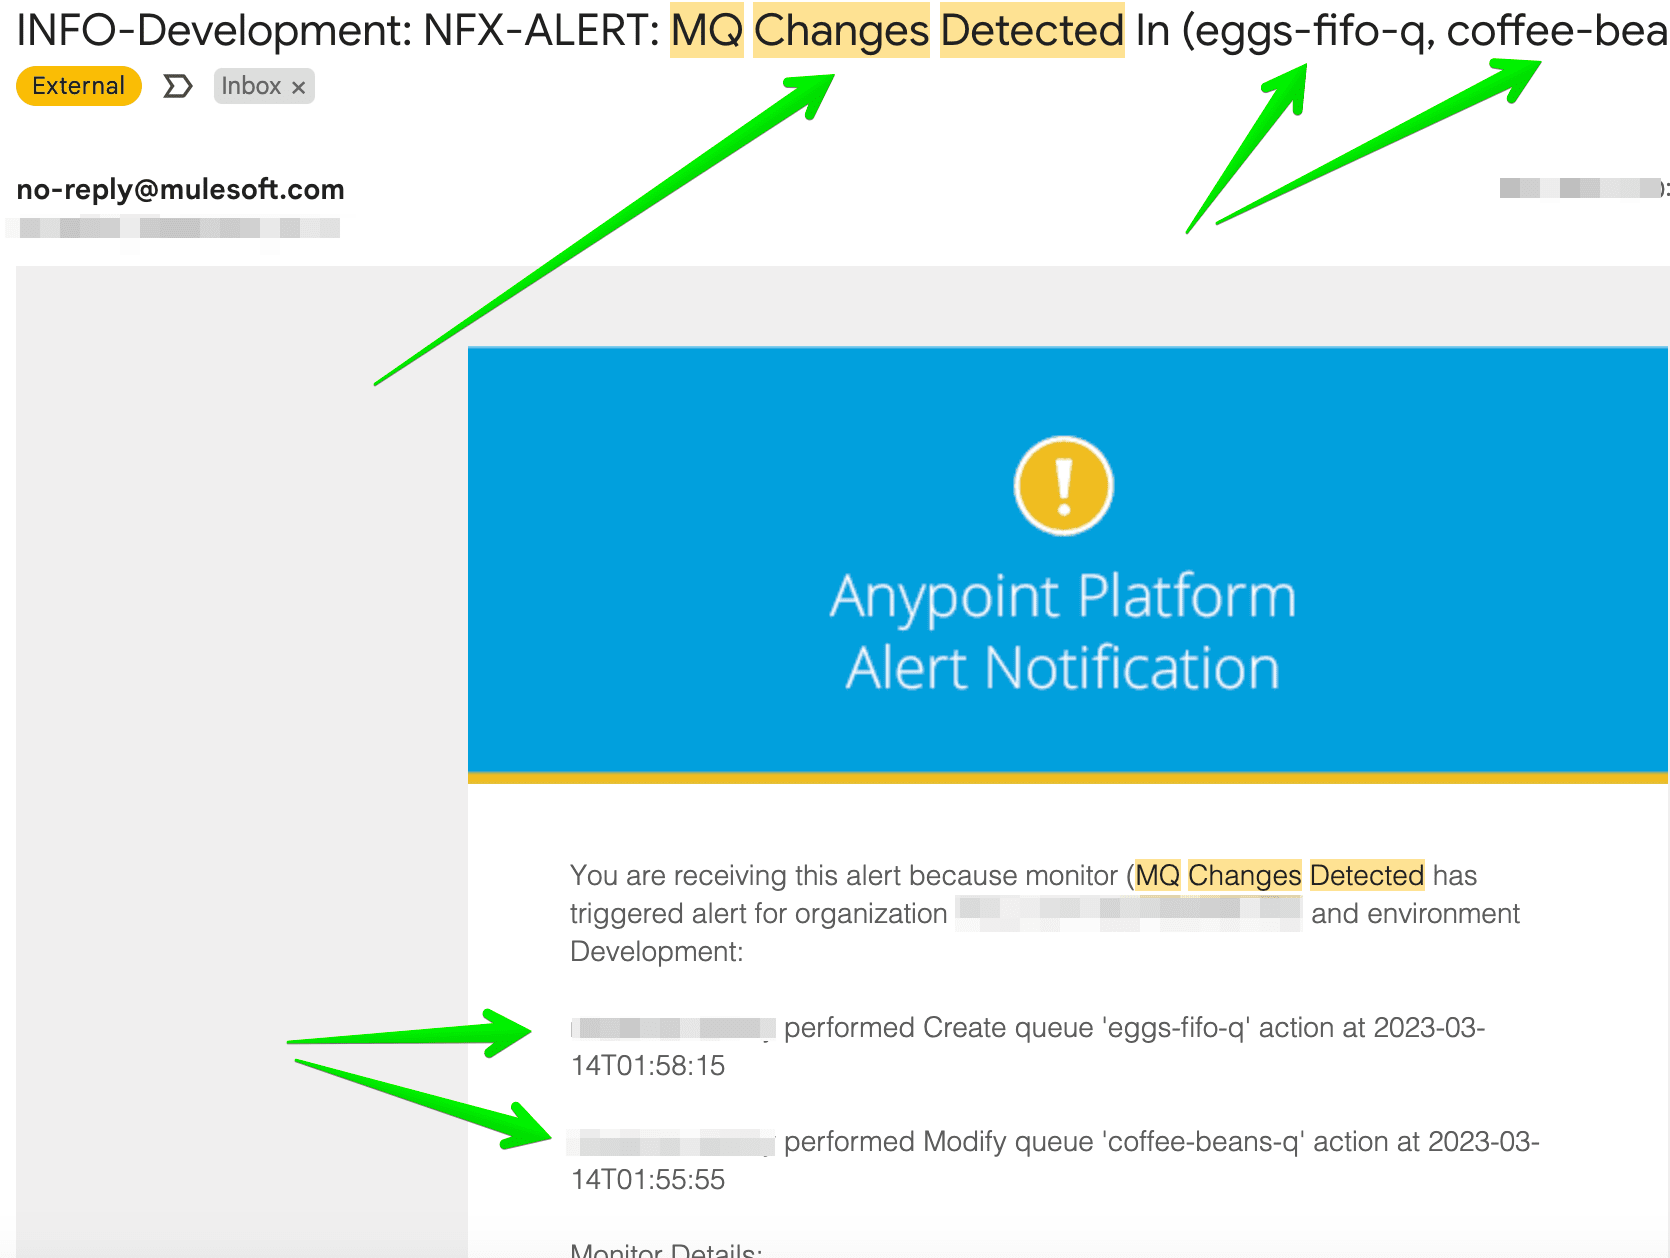
MQ Changes Detected
Triggered by finding Anypoint MQ changes in audit logs based on time interval from (now – polling interval) to now.
This information is import to keep track of in case of unexpected changes to production definitions of your queues and exchanges to prevent critical issues before they happen.
Common Parameters
| Parameter Name | Purpose |
| Criticality | Failure, Warning, Problem or Info. |
| Notification Methods | Cloudhub Notifications, supporting email and slack notifications. |
| Email Recipients | Required only for ’email’ method. |
| Triggering Condition Threshold | For example, to set up a monitor that checks if queue depth is over 10, monitor should be Queue Depth >= and threshold parameter of 10. For some monitors like MQ Changes Detected this field is irrelevant. |
| Interval between Occurrences (minutes) | Allows to ignore subsequent occurrences of the alarm for a specified period of time, after monitoring condition occurred for the first time.
Example: Monitor A has |
| Polling Interval (minutes) | Controls frequency with which monitored condition is checked. Minimal value is 1 minute.
NOTE: This value is set from |
| Resolution Instructions | Provides a way to customize messages for each monitor. You are encouraged to use this field to instruct your DevOps staff about handling of this alarm. You can use all the custom tags that are used in Alert Text. |
Prerequisites:
Must have 0.2 v-core available in the targeted CloudHub environments. Although we run all our tests against 0.1v-core without any issues we do recommend 0.2v-cores for any application running in CloudHub.
Connected
Installation:
Deploy NFX-MQ application .zip to any environment using any naming convention. There is no need to deploy more than 1 instance of NFX-MQ application in order to monitor all of your Anypoint MQ environments. Environment as well as organization name is configurable within the monitor itself using corresponding names (ids will be automatically discovered using Anypoint profile endpoint). Once application is up and running, it will initiate creation of all alerts within the default environment (only in beta version, release will propagate the changes to all environments).
CloudHub Properties:
anypoint.platform.config.analytics.agent.enabled=true

anypoint.platform.client_id=

anypoint.platform.client_secret=

mule.env=local

mule.key=1234567890

api.apiId=

app.category=com.netflexity.amq

anypoint.defaults.organizationName=Netflexity

anypoint.defaults.environmentName=Development

anypointmq.region=us-east-1

secure\:\:cloudhub.client_id=

secure\:\:cloudhub.client_secret=
Alert Setup:
Upon application start up, you will find the following alerts generated in your default environment (set through CloudHub properties above). Note, these are provided as templates and can be further modified per your organization’s conventions.
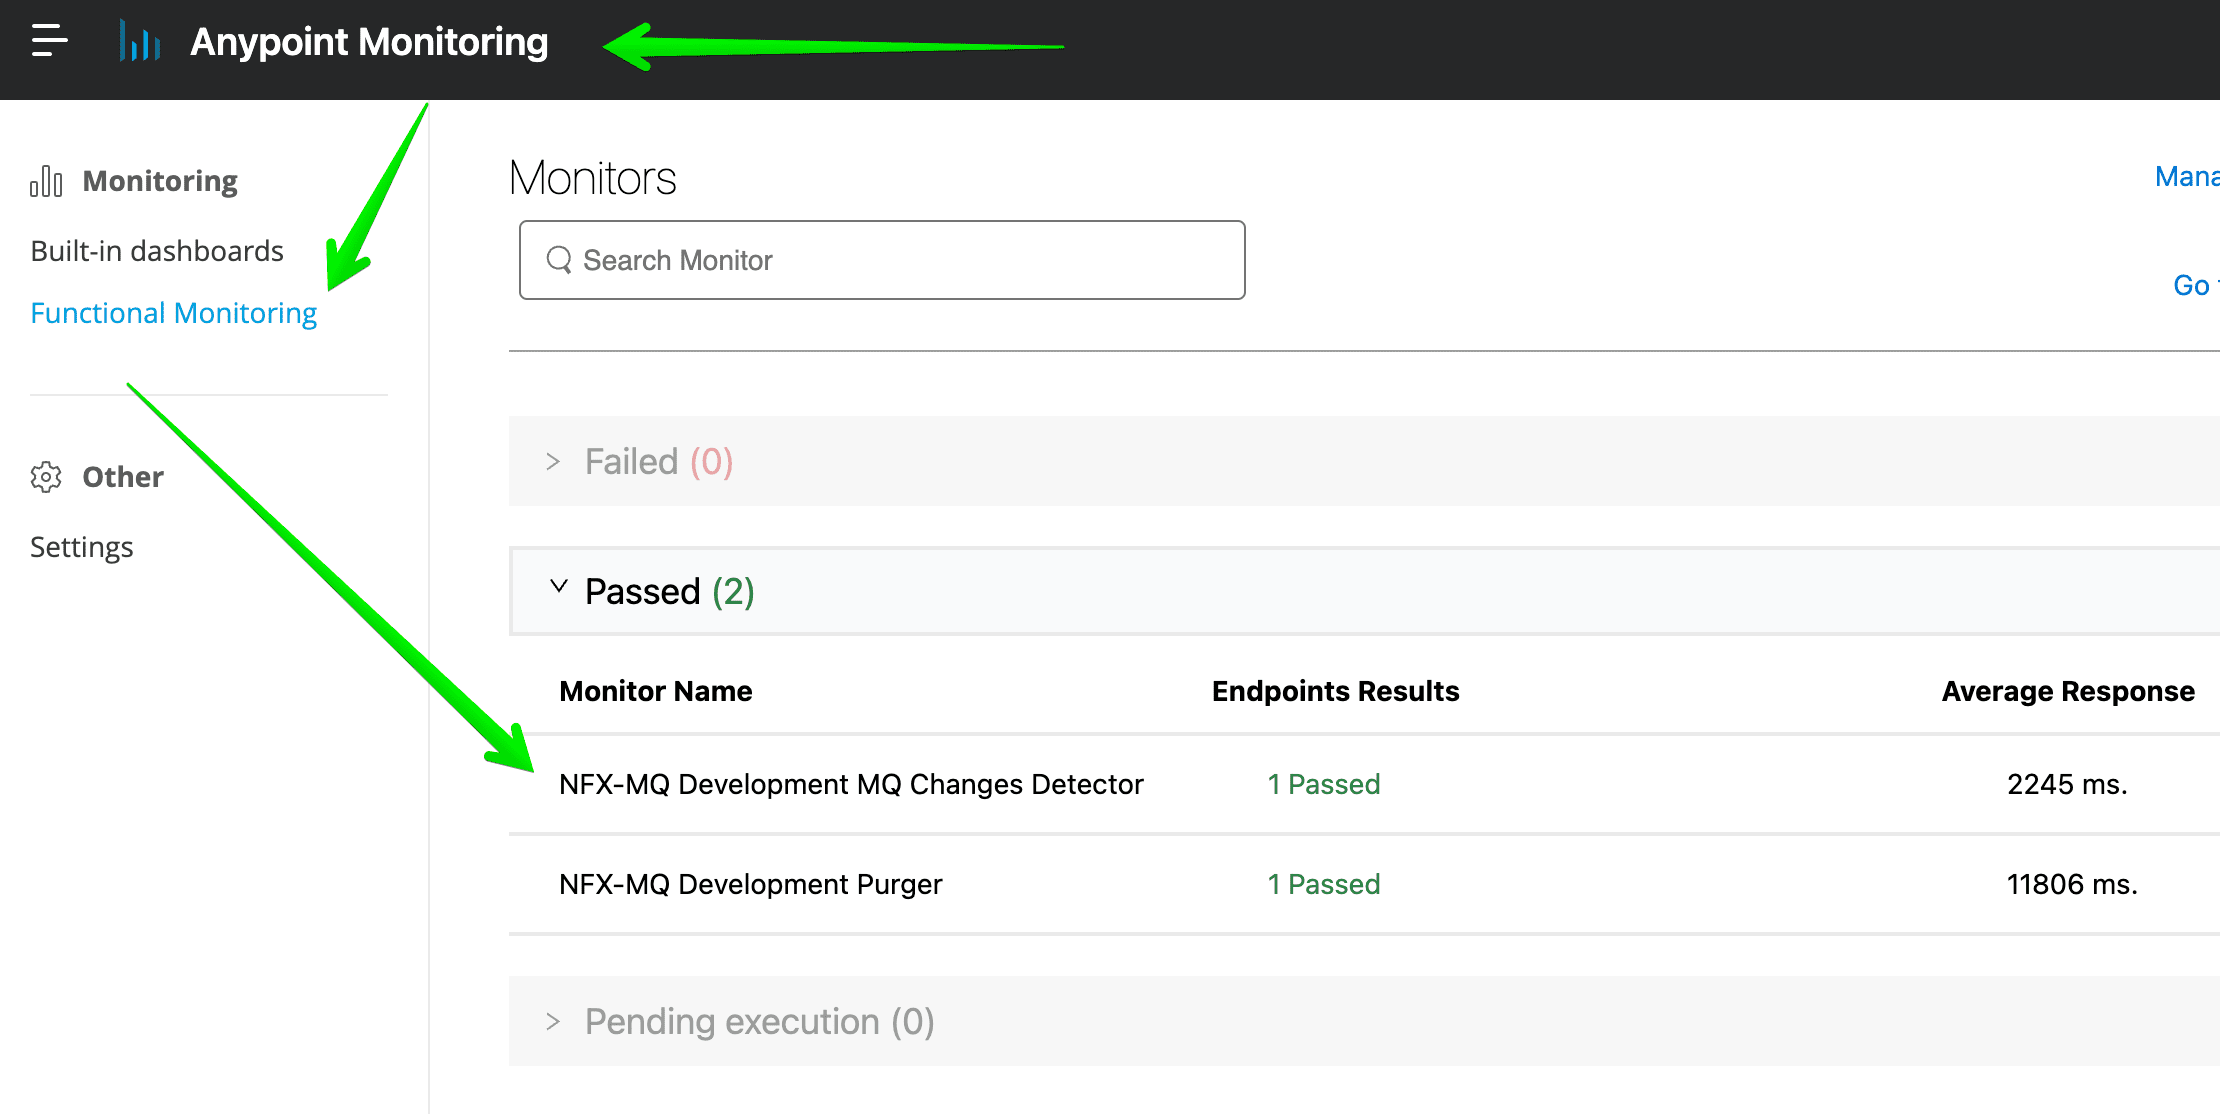
Functional Monitoring Setup:
We are going to utilize functional monitors as a scheduling tool for invoking NFX-MQ monitors so you can add as many endpoints to a single monitor that satisfied your polling interval. For example, you can setup all the monitors to run on hourly basis thus needing only a single functional monitor setup.
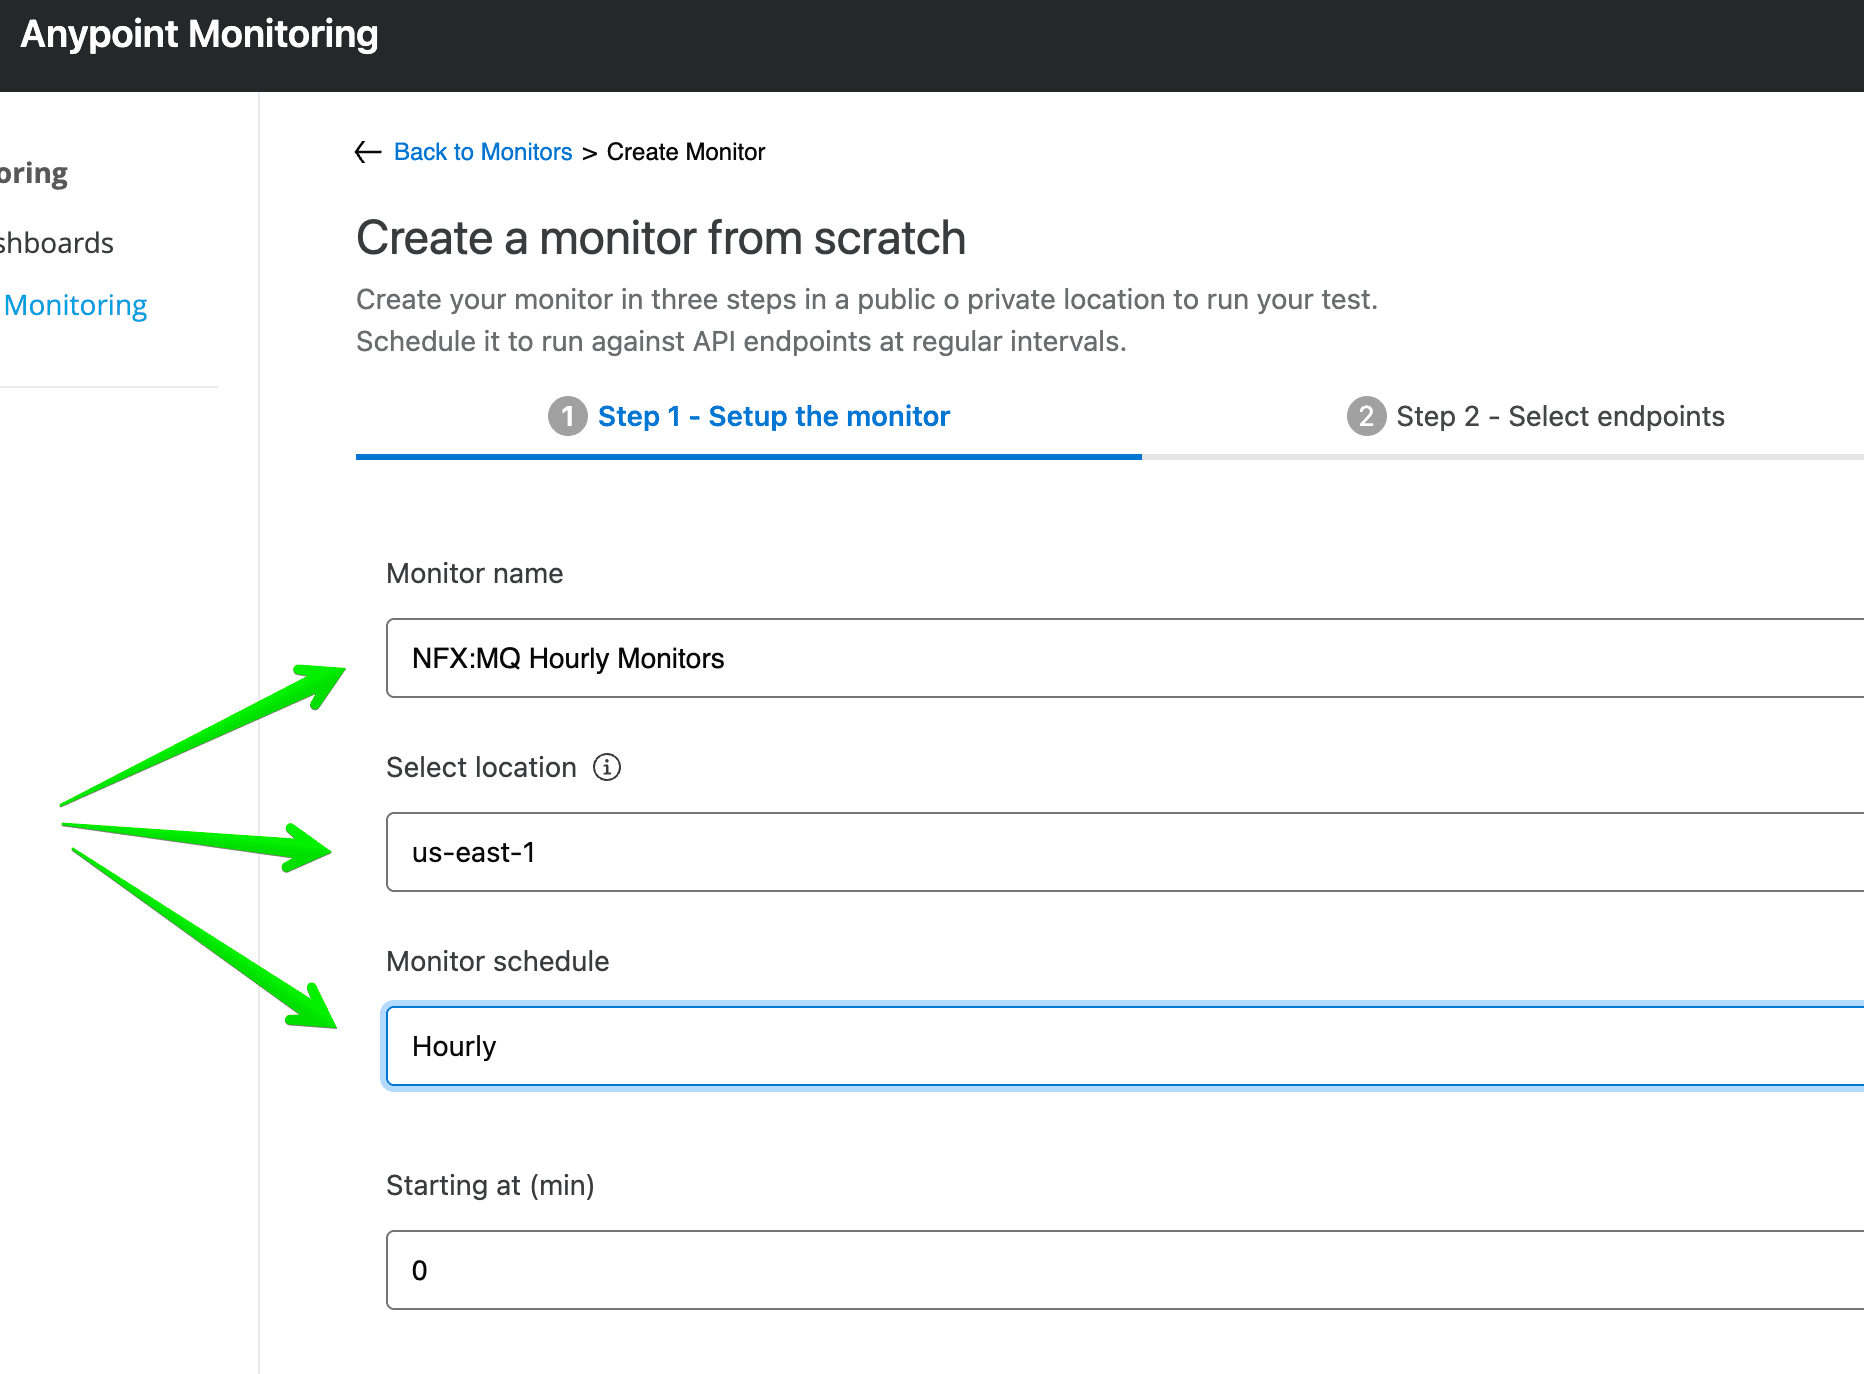
- Create new monitor by pressing
Create Monitorin the top right corner. - Give any desired name.
- Select proper location (private location in case of DLB)
- Select monitor schedule (
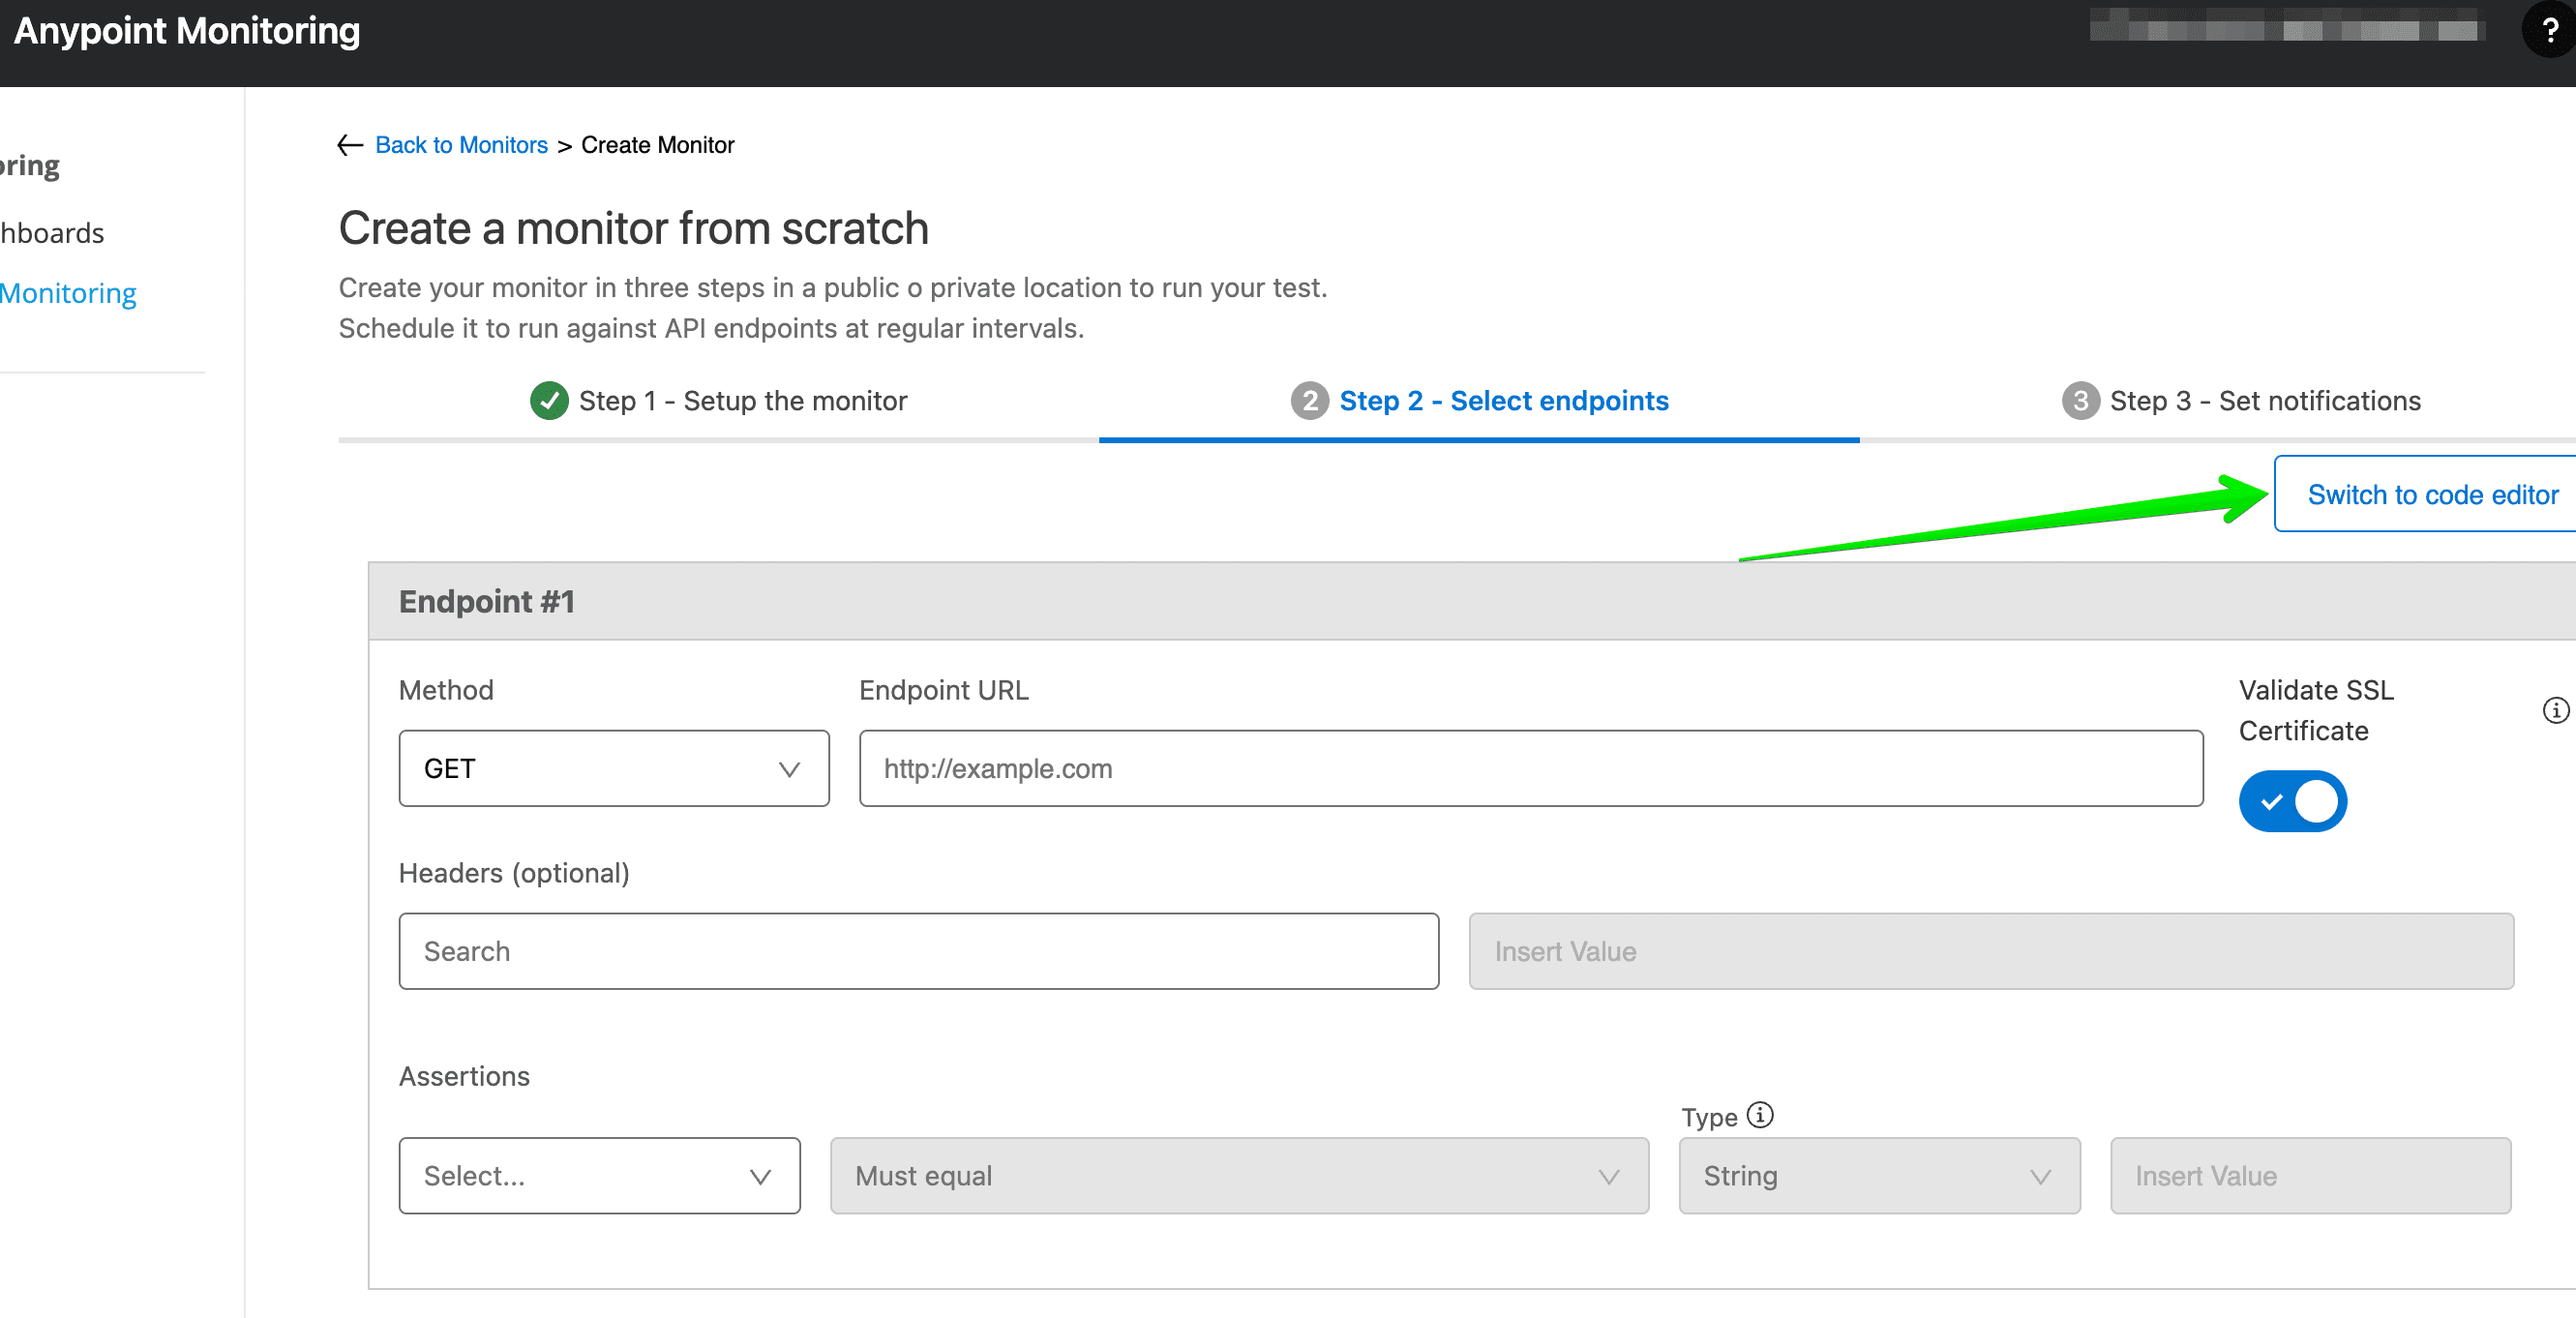
hourlyas an example) - On the next screen, switch to
Code Editorand use one of the provided examples below or setup endpoints manually. - Click
Nextand skipnotificationsby pressingCreate Monitor(we don’t need notifications since these functional monitors will be utilized as smart schedulers forNFX-MQmonitoring needs).
Functional Monitoring Templates:
- Queue Depth >= and Queue Depth <=
- Queue In-Flight Count >= and Queue In-Flight Count <=
- Queue Messages Sent Count >= and Queue Messages Sent Count <=
- Queue Messages Received Count >= and Queue Messages Received Count <=
- Queue QoS Dequeue Rate Less Than %
- Stale Messages
- MQ Changes Detected
- Queue Message Mover (Cut from queue X and Push to target queue Y)